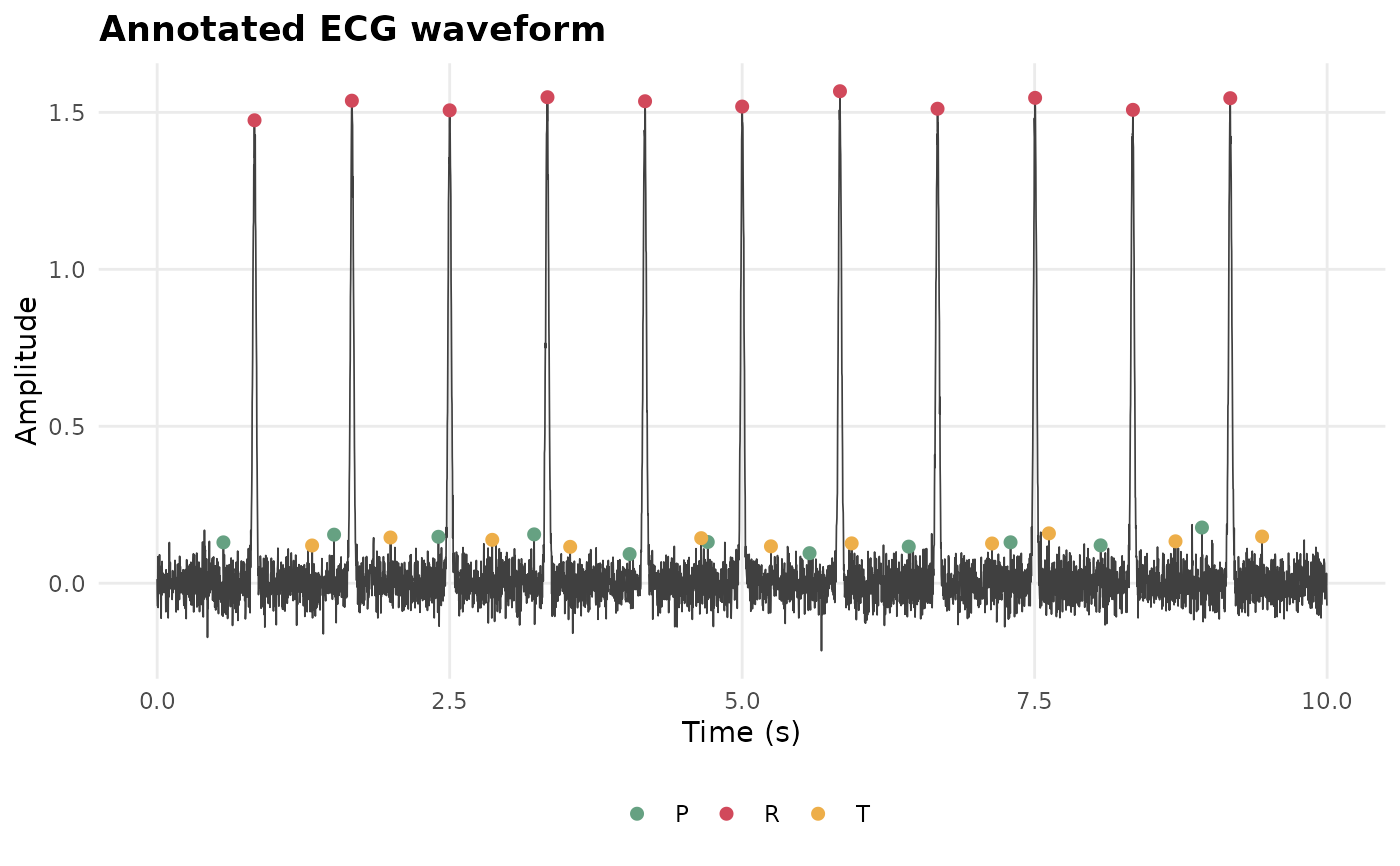
Plots the ECG waveform with P, QRS and T fiducials from
ecgDelineate. The detected R-peak sample indices are attached as
the "peaks" attribute (a beat-editing hook); the delineation is
attached as "delineation".
Arguments
- x
A PhysioExperiment object with ECG data.
- peaks
R-peak table from
ecgDetectRpeaks.- channel
Channel to plot (default: 1).
- window_sec
Seconds of signal to display from the start (default 10; NULL for the whole recording).
- assay_name
Input assay name (default: first assay).
References
Pan, J. & Tompkins, W.J. (1985). A real-time QRS detection algorithm. IEEE TBME, 32(3), 230-236.
Examples
pe <- make_ecg(5000, sr = 500)
pk <- ecgDetectRpeaks(pe)
plotEcgWave(pe, pk)