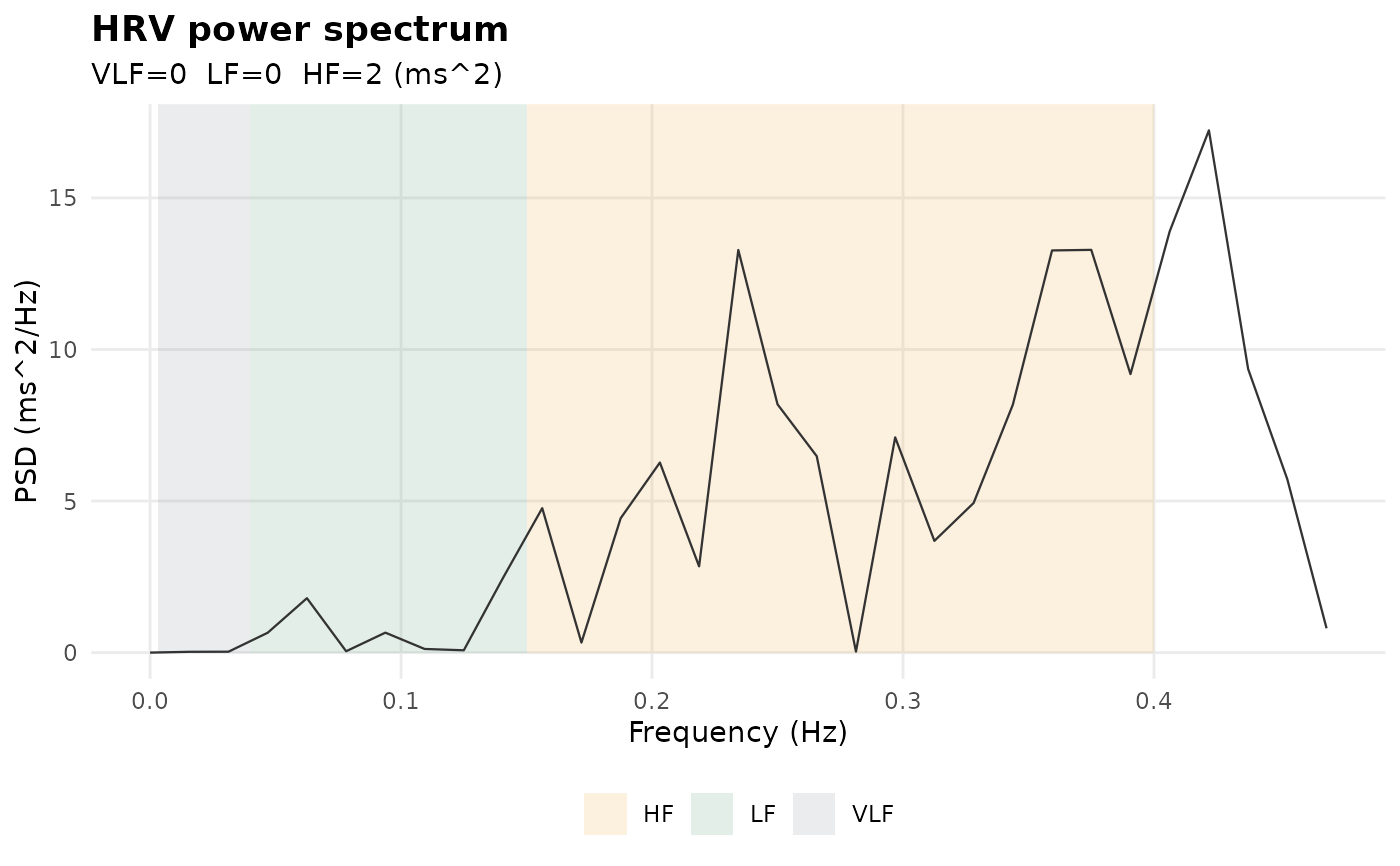
Plots the RR-interval power spectrum with the VLF, LF and HF bands shaded and
their integrated powers annotated. The PSD and band integration reuse the same
internals as ecgHRVfreq, so the shaded band areas equal the
ecgHRVfreq band powers. The band powers are attached as the
"band_power" attribute.
Arguments
- rr
An rr data.frame or an object from
ecgProcess.- method
Spectral method ("welch" default, "ar" or "lomb"), matching
ecgHRVfreq.- detrend
Smoothness-priors detrending, matching
ecgHRVfreq.- channel
Channel to plot (default: first).
- vlf_band, lf_band, hf_band
Band edges (Hz).
Examples
pe <- make_ecg(40000, sr = 500)
rr <- ecgRRintervals(pe, ecgDetectRpeaks(pe))
plotHRVpsd(rr)