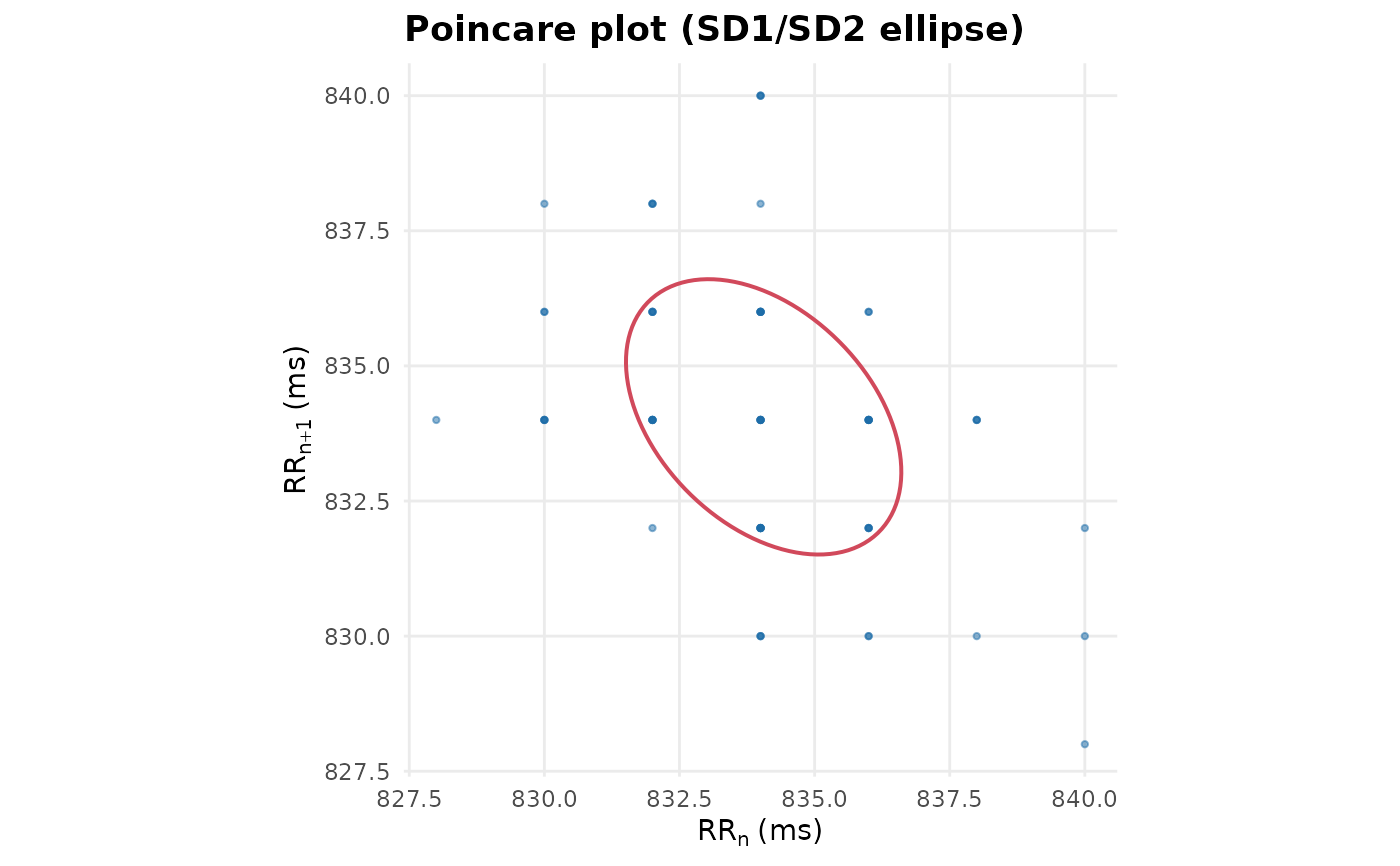
Scatters each RR interval against the next (\(RR_n\) vs \(RR_{n+1}\)) and
overlays the Poincare SD1/SD2 dispersion ellipse from
ecgHRVpoincare. The SD1 and SD2 used for the ellipse are
attached as the "sd1"/"sd2" attributes of the returned plot.
Arguments
- rr
An rr data.frame or an object from
ecgProcess.
References
Brennan, M., Palaniswami, M. & Kamen, P. (2001). Do existing measures of Poincare plot geometry reflect nonlinear features of heart rate variability? IEEE TBME, 48(11), 1342-1347.
Examples
pe <- make_ecg(30000, sr = 500)
rr <- ecgRRintervals(pe, ecgDetectRpeaks(pe))
plotPoincare(rr)