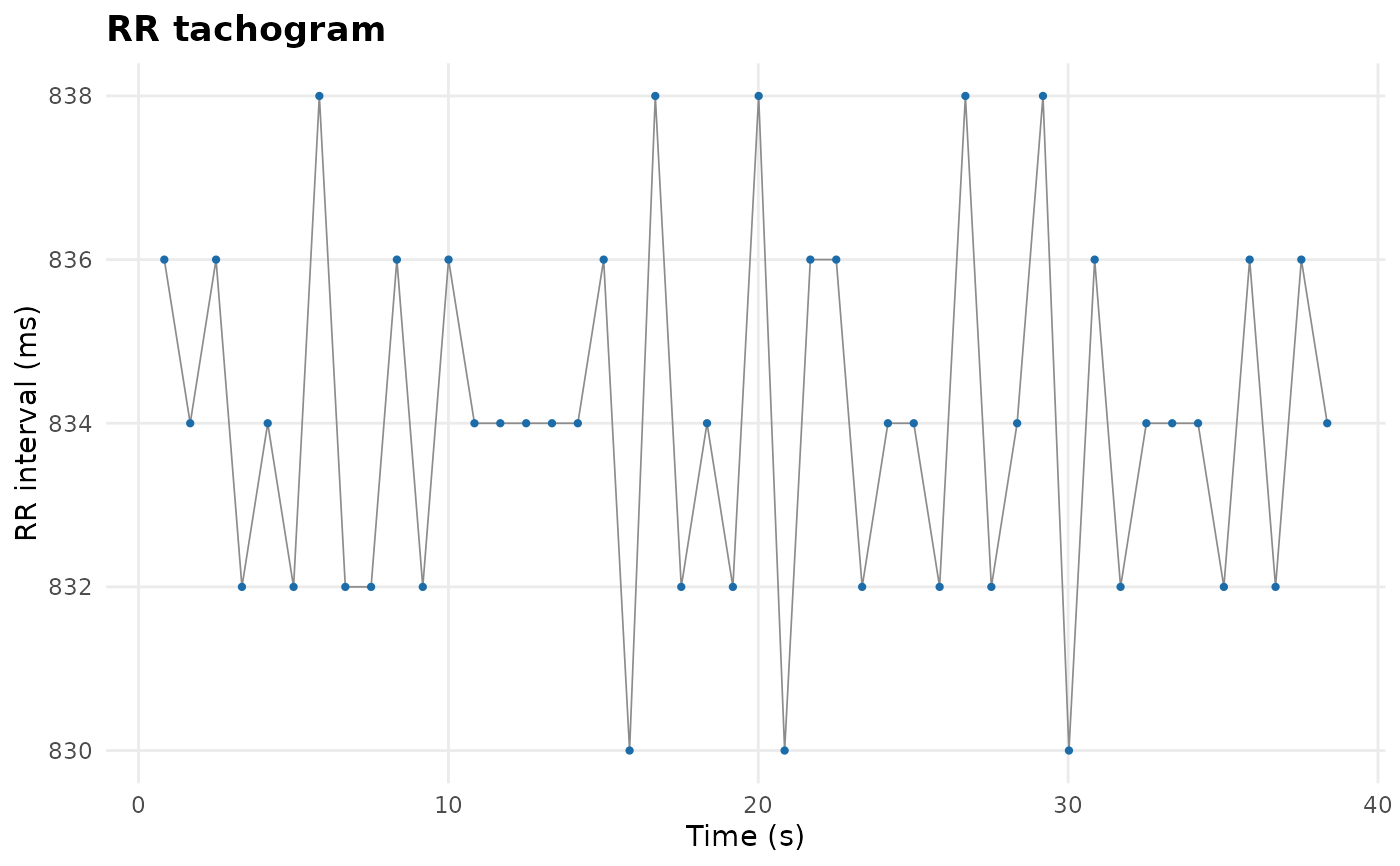
Plots the RR interval series against time, marking ectopic beats when an
is_ectopic column is present.
Arguments
- rr
An rr data.frame (columns
rr_ms,time_secand optionallychannel,is_ectopic) or an object returned byecgProcess.
Examples
pe <- make_ecg(20000, sr = 500)
rr <- ecgQualityCheck(ecgRRintervals(pe, ecgDetectRpeaks(pe)))
plotTachogram(rr)