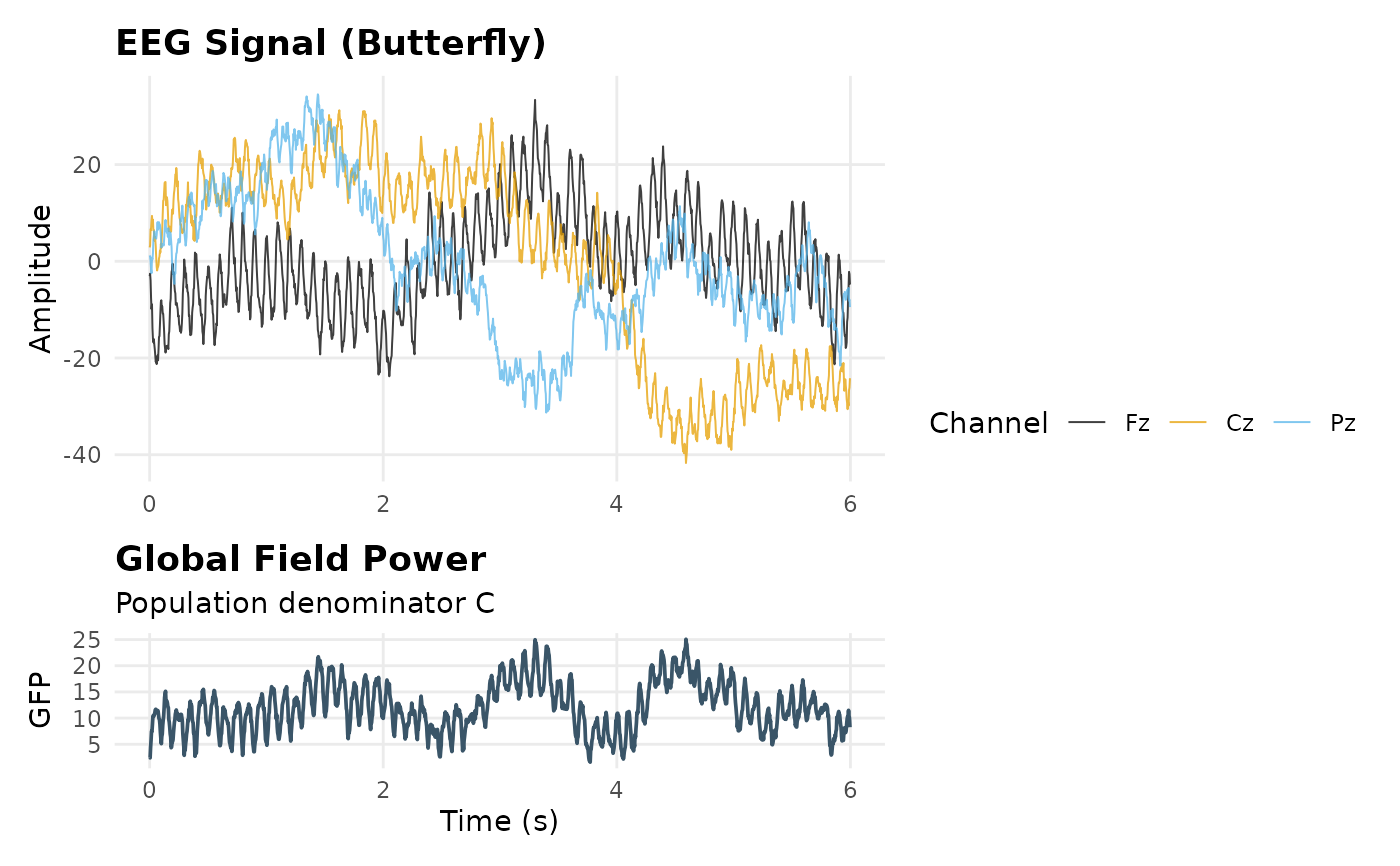
Displays the selected continuous EEG channels as a butterfly plot above their Global Field Power (GFP). GFP is the spatial dispersion across the displayed channels at each time point, so its magnitude depends on the selected channels and EEG reference. It is not source-localized power.
Arguments
- x
A PhysioExperiment object containing a numeric 2D continuous EEG assay (time x channels).
- channels
Unique character vector of exact channel labels. If
NULL, all channels are shown.- time_range
Optional finite increasing length-two vector specifying the inclusive display range in seconds. GFP is calculated before display windowing.
- show_events
Logical; draw finite event times from
metadata(x)$eventson both panels.- assay_name
Input assay name. If
NULL, uses the default assay.- gfp_definition
Denominator used for spatial dispersion:
"population"divides by C and matcheseegMicrostates();"sample"divides by C - 1.- heights
Two finite positive values giving the butterfly and GFP panel height ratio.
Examples
if (requireNamespace("ggplot2", quietly = TRUE) && requireNamespace("patchwork", quietly = TRUE)) {
  pe <- make_eeg(n_time = 1500, n_channels = 19, sr = 250)
  eegPlotButterflyGFP(pe, channels = c("Fz", "Cz", "Pz"))
}