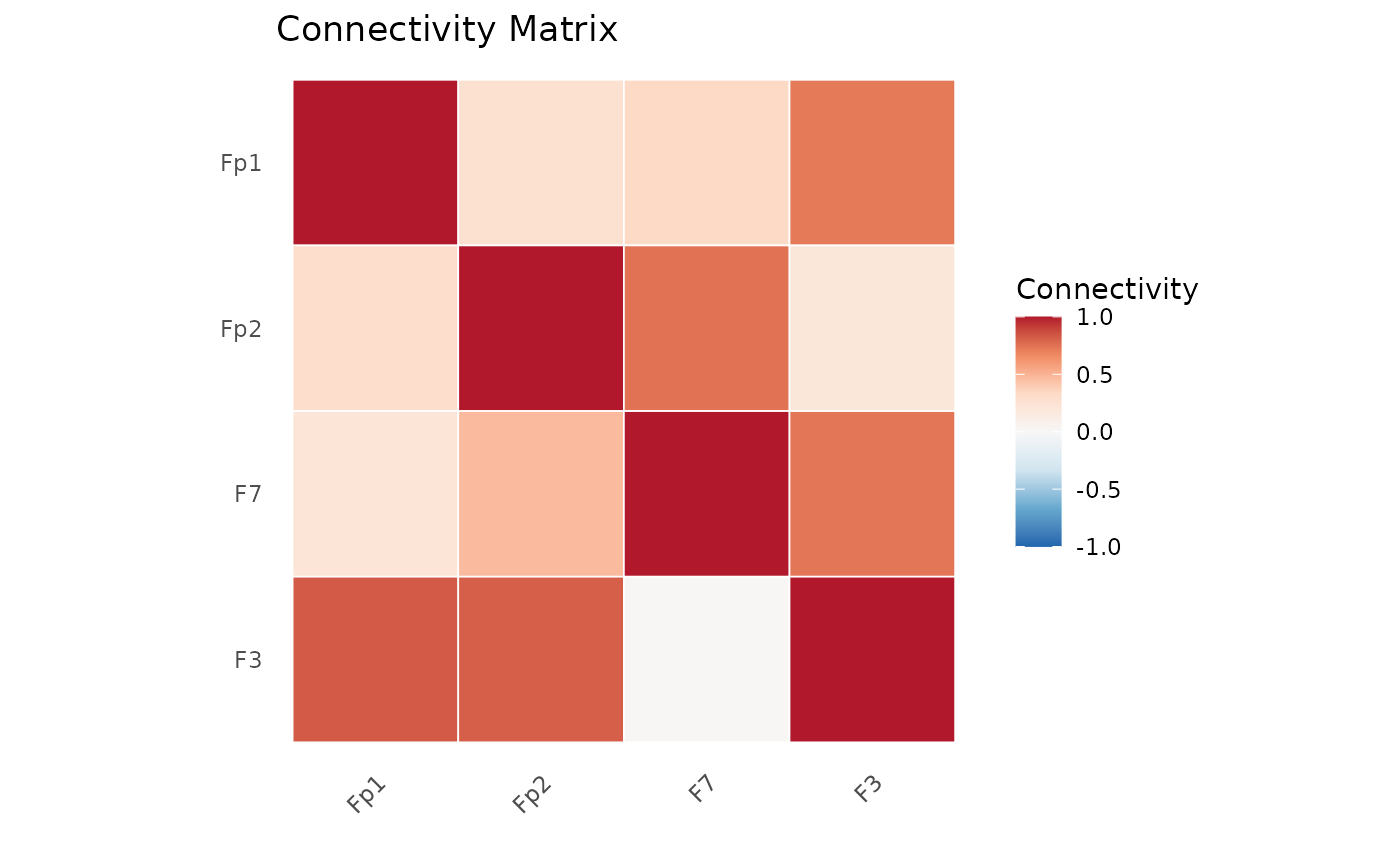
Visualizes EEG connectivity as either a heatmap (matrix) or a circular
connectivity plot (circle). The connectivity matrix can be provided
directly or read from metadata(x)$connectivity$matrix.
Usage
eegPlotConnectivity(
  x,
  method = c("heatmap", "circle"),
  matrix = NULL,
  threshold = 0,
  labels = NULL,
  palette = "RdBu"
)
Arguments
- x
A PhysioExperiment object with EEG data.
- method
Display method:
"heatmap"for a correlation/connectivity matrix heatmap or"circle"for a circular connectivity diagram.- matrix
Numeric matrix of connectivity values. If
NULL, reads frommetadata(x)$connectivity$matrix.- threshold
Numeric; only show connections above this value (default: 0).
- labels
Character vector of channel labels. If
NULL, uses row/column names of the matrix or channel labels from colData.- palette
Character name of the diverging color palette (default:
"RdBu").
Examples
if (requireNamespace("ggplot2", quietly = TRUE)) {
  mat <- matrix(runif(16), 4, 4)
  diag(mat) <- 1
  pe <- make_eeg(n_time = 1000, n_channels = 4, sr = 250)
  eegPlotConnectivity(pe, method = "heatmap", matrix = mat)
}