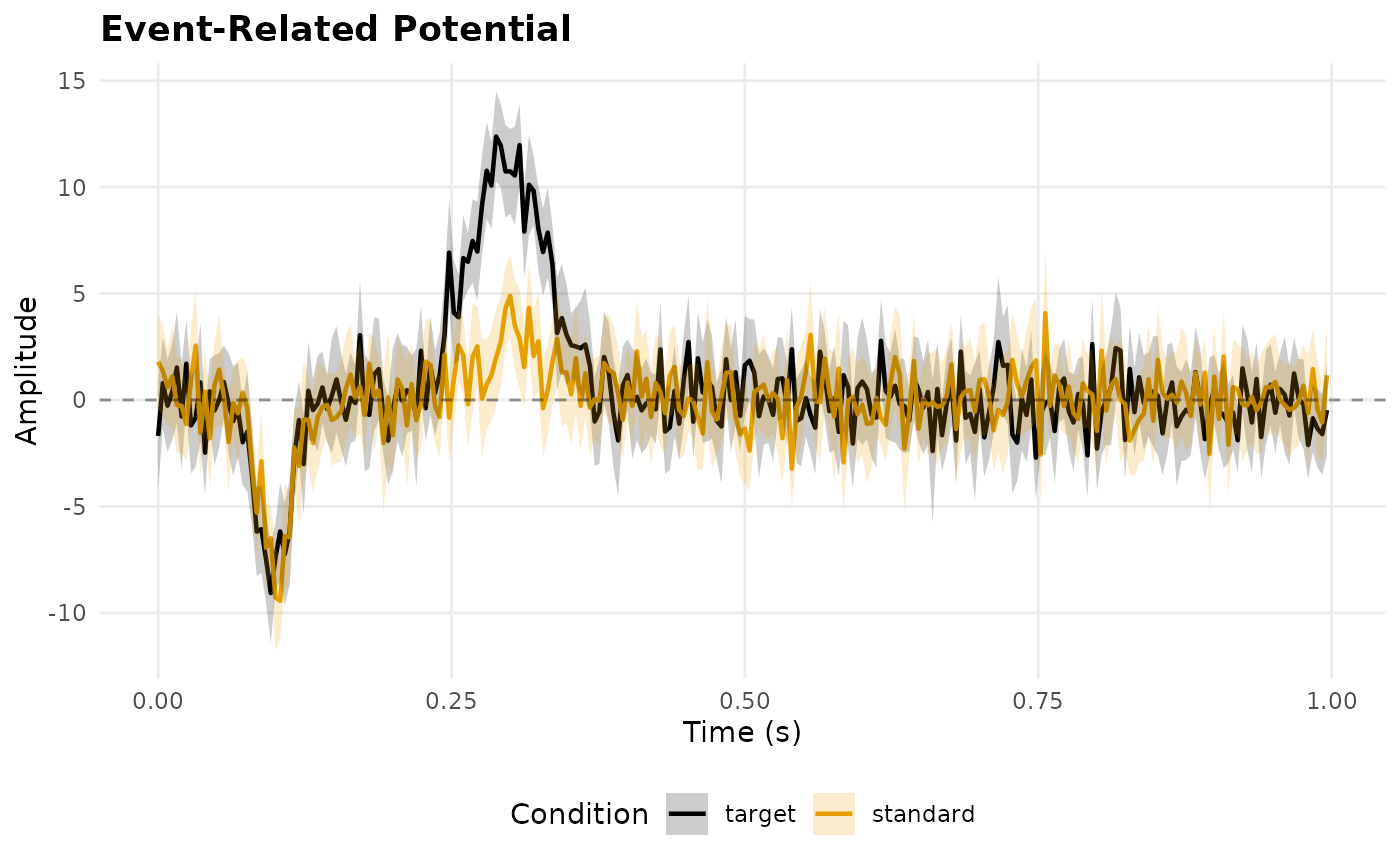
Plots event-related potential waveforms averaged across epochs, with
optional confidence interval ribbons. Supports condition-based
comparisons when metadata(x)$conditions is available.
Usage
eegPlotERP(
  x,
  channels = NULL,
  conditions = NULL,
  ci = 0.95,
  show_ci = TRUE,
  epoch_start = 0,
  assay_name = NULL
)
Arguments
- x
A PhysioExperiment object with epoched (3D) EEG data (time x channels x epochs).
- channels
Character vector of channel labels to plot. If
NULL, the grand average across all channels is used.- conditions
Character vector of condition labels to include. If
NULLandmetadata(x)$conditionsexists, all conditions are plotted.- ci
Confidence level for the interval (default: 0.95).
- show_ci
Logical; if
TRUE, display confidence interval ribbon.- epoch_start
Numeric start time of each epoch in seconds for the x-axis (default: 0).
- assay_name
Input assay name. If
NULL, uses the default assay.
Examples
if (requireNamespace("ggplot2", quietly = TRUE)) {
  pe <- make_eeg_erp(n_epochs = 40, sr = 250)
  eegPlotERP(pe, channels = "Cz")
}