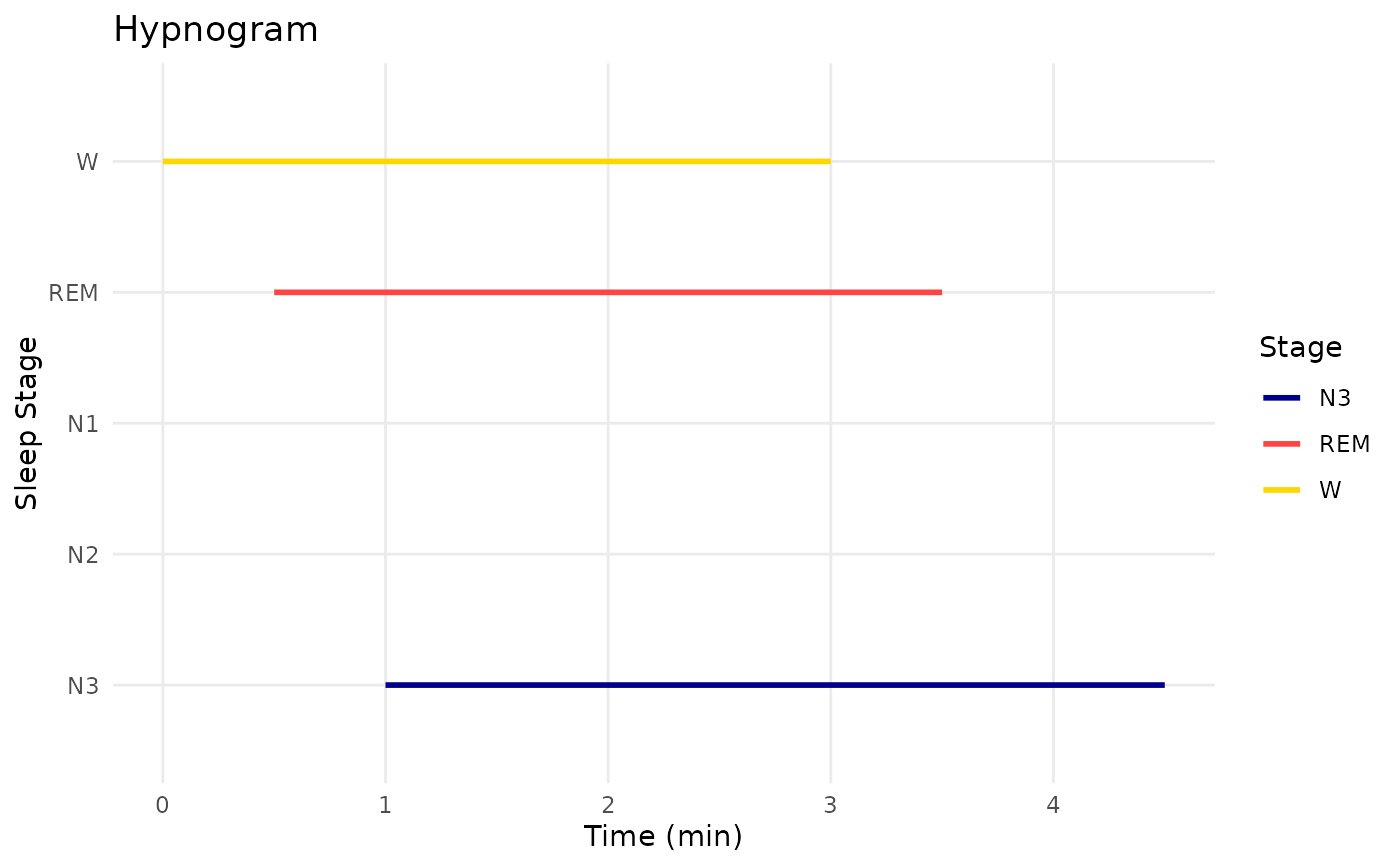
Displays a sleep hypnogram showing sleep stage transitions over time. Stages are ordered with Wake at the top and N3 at the bottom, with a characteristic staircase pattern.
Examples
if (requireNamespace("ggplot2", quietly = TRUE)) {
  pe <- make_eeg_sleep(n_time = 150000, n_channels = 2, sr = 500)
  stages <- eegSleepStage(pe)
  S4Vectors::metadata(pe)$sleep_stages <- stages
  eegPlotHypnogram(pe)
}