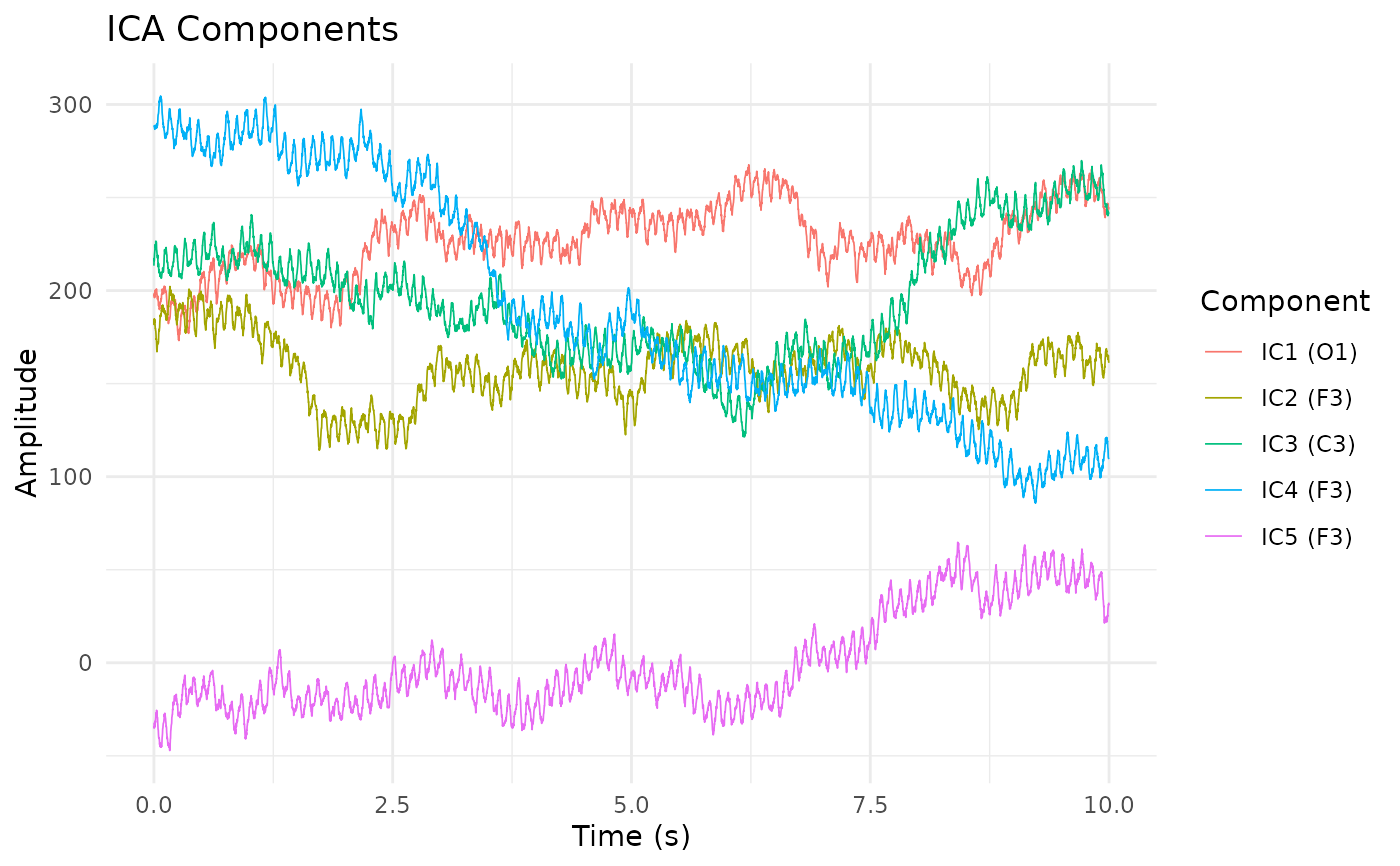
Displays ICA component time courses in a stacked layout similar to
eegPlotSignal. Optionally shows topographic maps of the mixing
matrix weights as a side panel annotation.
Usage
eegPlotICA(
  x,
  components = NULL,
  time_range = NULL,
  show_topography = TRUE,
  assay_name = NULL
)
Arguments
- x
A PhysioExperiment object with ICA results.
- components
Integer vector of component indices to display. If
NULL, the first 10 (or fewer) are shown.- time_range
Numeric vector of length 2 specifying time range in seconds. If
NULL, all data is shown.- show_topography
Logical; if
TRUEand ICA mixing matrix is available inmetadata(x)$ica$mixing, include topographic inset labels.- assay_name
Input assay name. If
NULL, uses"ica"if available, otherwise the default assay.
Examples
if (requireNamespace("ggplot2", quietly = TRUE)) {
  pe <- make_eeg(n_time = 5000, n_channels = 19, sr = 500)
  pe <- eegICA(pe, n_components = 10)
  eegPlotICA(pe, components = 1:5)
}