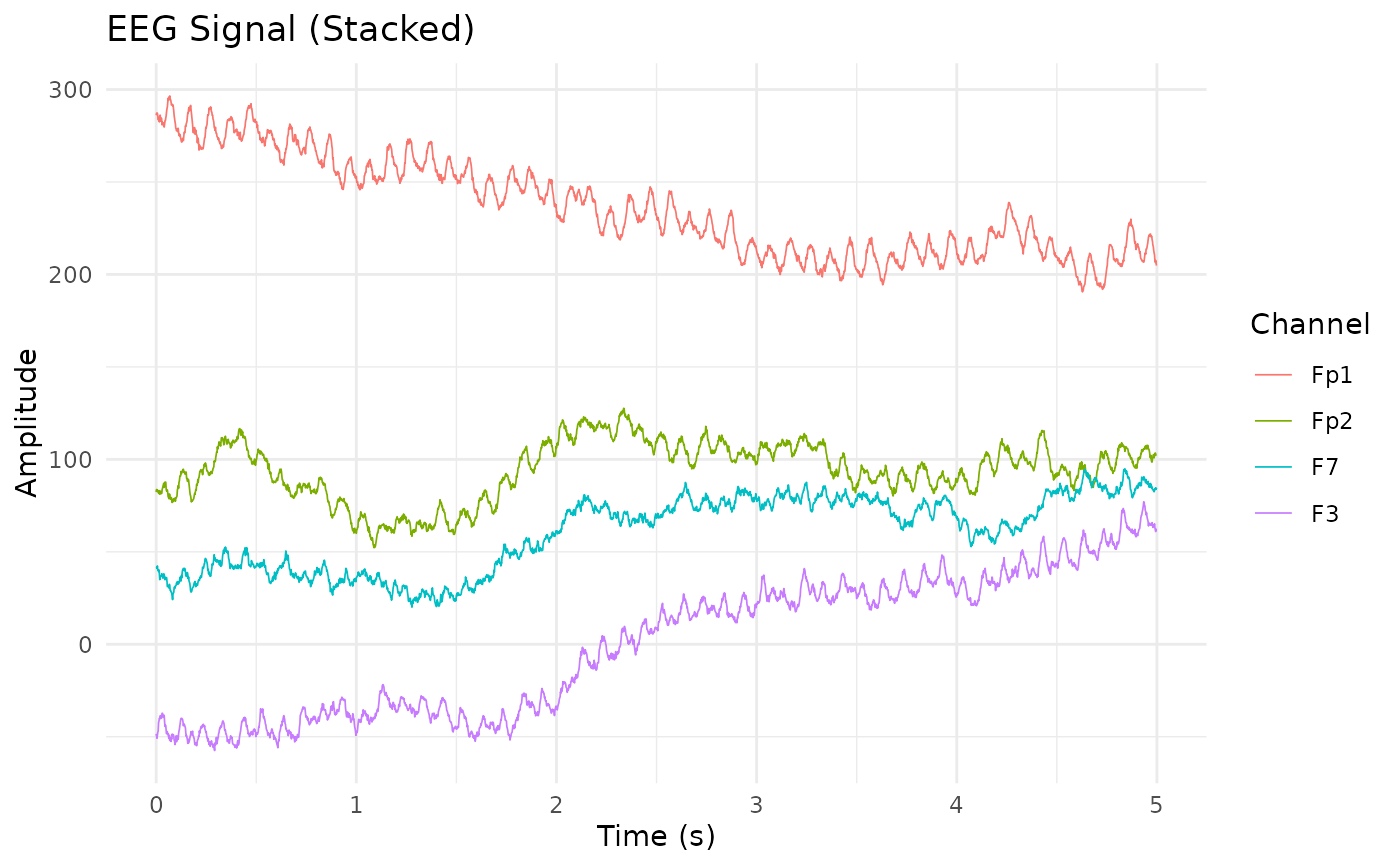
Displays multi-channel EEG time series in stacked, butterfly, or grid layout. Supports channel selection, time range restriction, and optional event markers.
Usage
eegPlotSignal(
  x,
  channels = NULL,
  time_range = NULL,
  mode = c("stacked", "butterfly", "grid"),
  scale = 1,
  show_events = FALSE,
  assay_name = NULL
)
Arguments
- x
A PhysioExperiment object with 2D EEG data (time x channels).
- channels
Character vector of channel labels to display. If
NULL, all channels are shown.- time_range
Numeric vector of length 2 specifying time range in seconds as
c(start, end). IfNULL, all data is shown.- mode
Display mode:
"stacked"(vertical offset per channel),"butterfly"(overlay all channels), or"grid"(faceted panels per channel).- scale
Numeric scaling factor for vertical offset in stacked mode (default: 1).
- show_events
Logical; if
TRUEandmetadata(x)$eventsexists, vertical lines are drawn at event times.- assay_name
Input assay name. If
NULL, uses the default assay.
Examples
if (requireNamespace("ggplot2", quietly = TRUE)) {
  pe <- make_eeg(n_time = 2500, n_channels = 4, sr = 500)
  eegPlotSignal(pe, mode = "stacked")
}