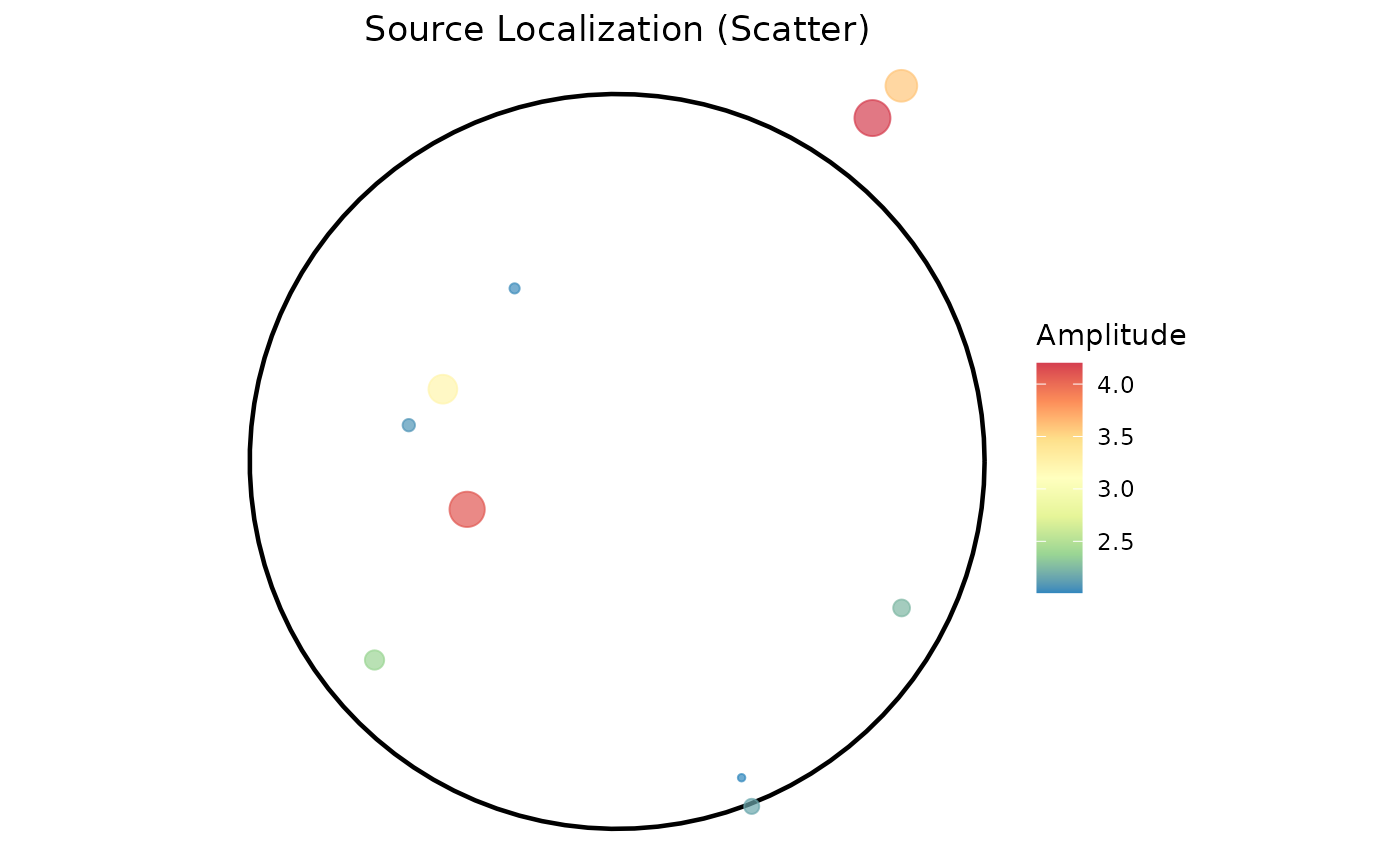
Visualizes source localization results as a 2D scatter plot or flat map projection. Sources are sized and colored by amplitude, with optional thresholding to show only the strongest activations.
Usage
eegPlotSource(
  x,
  source_data = NULL,
  method = c("scatter", "flatmap"),
  threshold_pct = 80
)
Arguments
- x
A PhysioExperiment object.
- source_data
Named numeric vector of source amplitudes or a data.frame with columns
x,y, andamplitude. IfNULL, reads frommetadata(x)$source_estimate.- method
Display method:
"scatter"for points on a 2D brain outline or"flatmap"for filled regions using interpolation.- threshold_pct
Numeric percentile threshold (0-100). Only sources above this percentile are displayed (default: 80).
Examples
if (requireNamespace("ggplot2", quietly = TRUE) && requireNamespace("patchwork", quietly = TRUE)) {
  pe <- make_eeg(n_time = 1000, n_channels = 19, sr = 250)
  src <- data.frame(x = runif(50, -1, 1), y = runif(50, -1, 1),
                    amplitude = rnorm(50)^2)
  eegPlotSource(pe, source_data = src, method = "scatter")
}