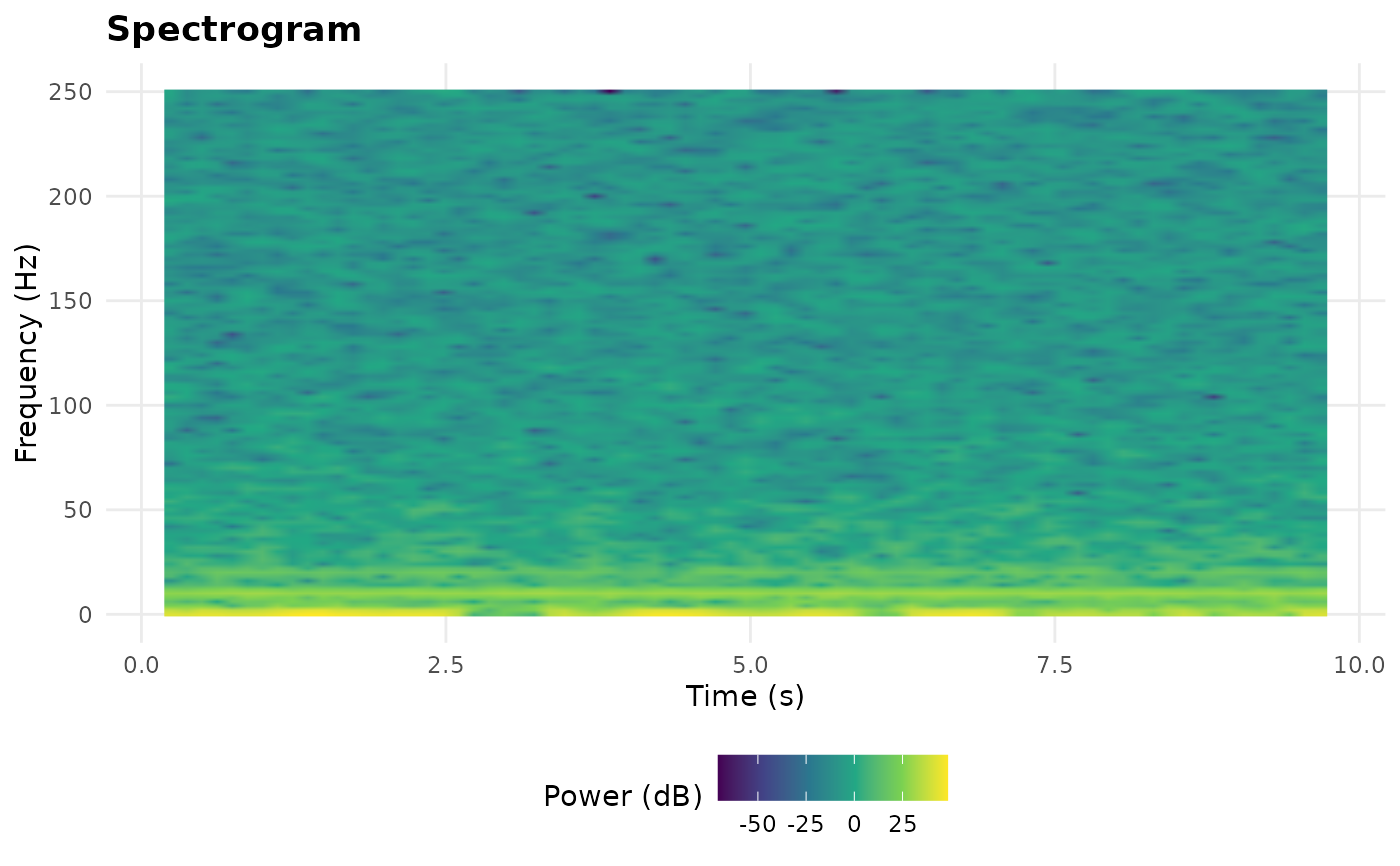
Displays a time-frequency representation of EEG data as a heatmap. It uses an unambiguous stored STFT, Morlet, or ERSP product when available. For a continuous 2D assay, it computes the established sliding-window FFT.
Usage
eegPlotSpectrogram(
  x,
  channel = 1,
  freq_range = NULL,
  time_range = NULL,
  log_power = TRUE,
  palette = "viridis",
  assay_name = NULL,
  mask = NULL,
  mask_alpha = 0.4,
  contour = TRUE
)
Arguments
- x
A PhysioExperiment object with EEG data.
- channel
Integer or character specifying which channel to display (default: 1).
- freq_range
Numeric vector of length 2 for frequency axis limits. If
NULL, the full range is shown.- time_range
Numeric vector of length 2 for time axis limits. If
NULL, the full range is shown.- log_power
Logical; if
TRUE, plot10*log10(power)(default: TRUE).- palette
Character name of the color palette (default:
"viridis").- assay_name
Input assay or time-frequency metadata product name. If
NULL, uses one unambiguous STFT, Morlet, or ERSP product when present, otherwise computes the legacy sliding FFT from the default assay.- mask
Optional display mask. Supply a logical time-by-frequency matrix, a p-value matrix with an explicit
alphaattribute, or a private time-frequency inference result. Matrix dimensions and dimnames must exactly match the complete, unfiltered time-frequency axes.- mask_alpha
Opacity for bins outside
mask, as one finite value in[0, 1](default: 0.4).- contour
Logical; draw non-interpolated boundaries between included and excluded mask bins when both are present (default: TRUE).
Details
A mask controls opacity and optional boundaries only. It never
replaces, zeros, or otherwise changes the plotted power values. Matrix
masks describe the complete time-by-frequency grid before
freq_range or time_range is applied.
Statistical masks must be computed from repeated, independent and exchangeable observations, not inferred from the single spectrogram being plotted. The package-private cluster helper subtracts the declared baseline within each replicate and frequency, uses sign-separated four-neighbour components and a maximum cluster-mass sign-flip null, and applies the conservative plus-one correction. Its corrected p-values are cluster-level evidence; they do not make each enclosed bin individually significant or establish a neurophysiological mechanism.
Examples
if (requireNamespace("ggplot2", quietly = TRUE)) {
  pe <- make_eeg(n_time = 5000, n_channels = 4, sr = 500)
  eegPlotSpectrogram(pe, channel = 1)
}