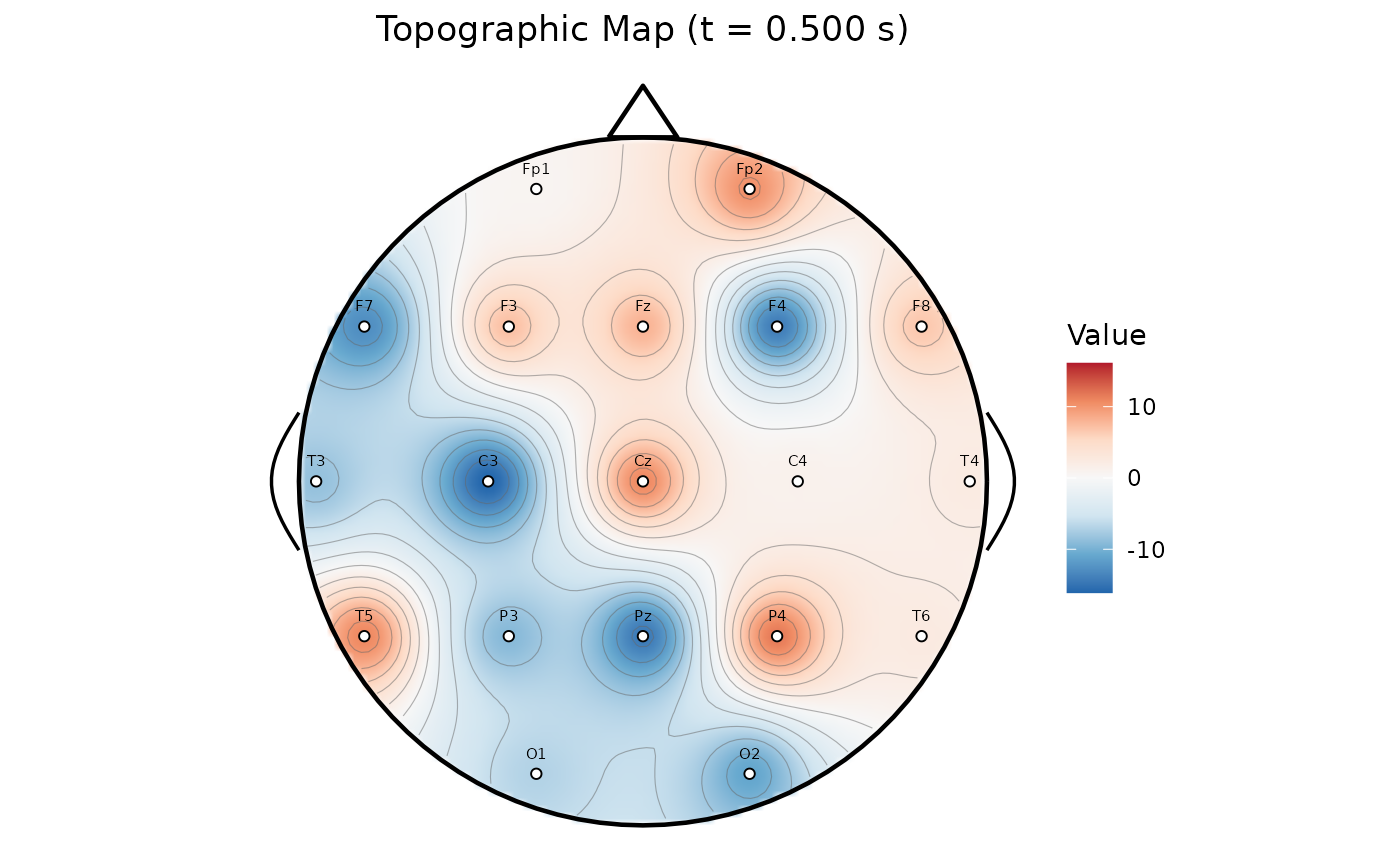
Creates a 2D scalp topographic map using inverse distance weighted
interpolation. Electrode positions are read from colData(x)
(columns pos_x, pos_y) or default 10-20 positions are
used as fallback. The plot includes a head outline, nose, and ears.
Usage
eegPlotTopomap(
  x,
  time = NULL,
  values = NULL,
  assay_name = NULL,
  resolution = 100,
  palette = "RdBu",
  contours = TRUE,
  electrodes = TRUE
)
Arguments
- x
A PhysioExperiment object with EEG data.
- time
Numeric time point in seconds at which to extract values from the assay. If
NULLandvaluesis alsoNULL, the mean across all time points is used.- values
Named numeric vector of channel values to plot directly. If provided, overrides data extraction from the assay.
- assay_name
Input assay name. If
NULL, uses the default assay.- resolution
Integer grid resolution for interpolation (default: 100).
- palette
Character name of the diverging color palette (default:
"RdBu").- contours
Logical; if
TRUE, add contour lines.- electrodes
Logical; if
TRUE, show electrode positions as points.
Examples
if (requireNamespace("ggplot2", quietly = TRUE)) {
  pe <- make_eeg(n_time = 500, n_channels = 19, sr = 250)
  eegPlotTopomap(pe, time = 0.5)
}