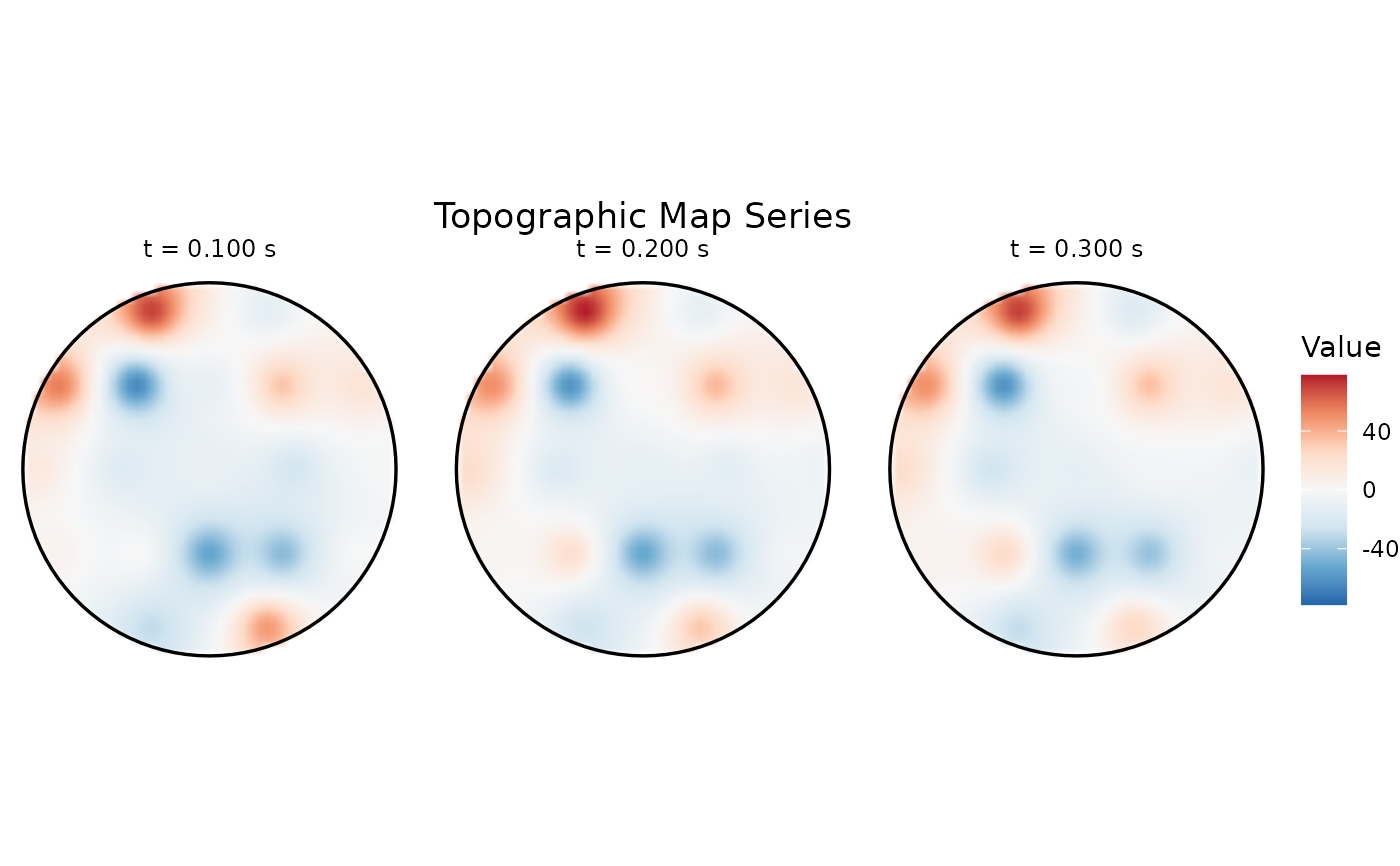
Creates multiple topographic maps at specified time points arranged in a grid layout with a shared or independent color scale.
Usage
eegPlotTopomapSeries(
  x,
  times,
  assay_name = NULL,
  ncol = NULL,
  palette = "RdBu",
  shared_limits = TRUE
)
Arguments
- x
A PhysioExperiment object with EEG data.
- times
Numeric vector of time points in seconds.
- assay_name
Input assay name. If
NULL, uses the default assay.- ncol
Integer number of columns in the grid layout. If
NULL, auto-calculated.- palette
Character name of the diverging color palette (default:
"RdBu").Logical; if
TRUE, use the same color scale across all panels.
Examples
if (requireNamespace("ggplot2", quietly = TRUE)) {
  pe <- make_eeg(n_time = 2500, n_channels = 19, sr = 500)
  eegPlotTopomapSeries(pe, times = c(0.1, 0.2, 0.3))
}