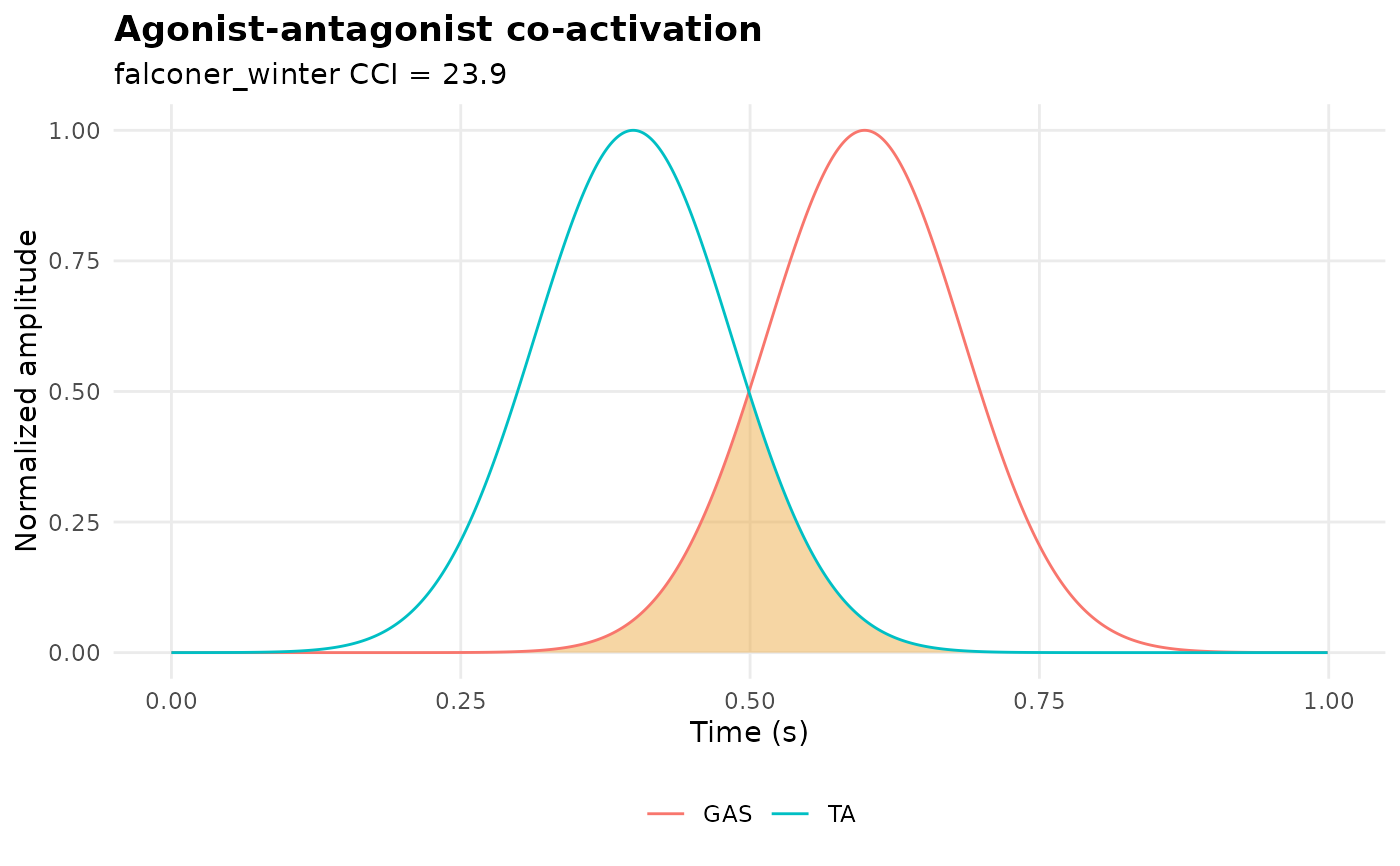
Overlays the agonist and antagonist envelopes and shades their common (co-contraction) area, annotated with the co-contraction index.
Usage
plotCoactivation(
  x,
  agonist,
  antagonist,
  method = c("falconer_winter", "rudolph", "frost"),
  normalize = TRUE,
  assay_name = NULL
)
Arguments
- x
A PhysioExperiment object of EMG envelopes.
- agonist, antagonist
Channel index or label of the two muscles.
- method
Co-contraction index for the annotation (see
emgCoContraction()).- normalize
Peak-normalize each channel before plotting (default: TRUE).
- assay_name
Input assay name (default: first assay).
References
Falconer, K. & Winter, D.A. (1985). "Quantitative assessment of co-contraction at the ankle joint in walking." Electromyography and Clinical Neurophysiology, 25(2-3), 135-149.