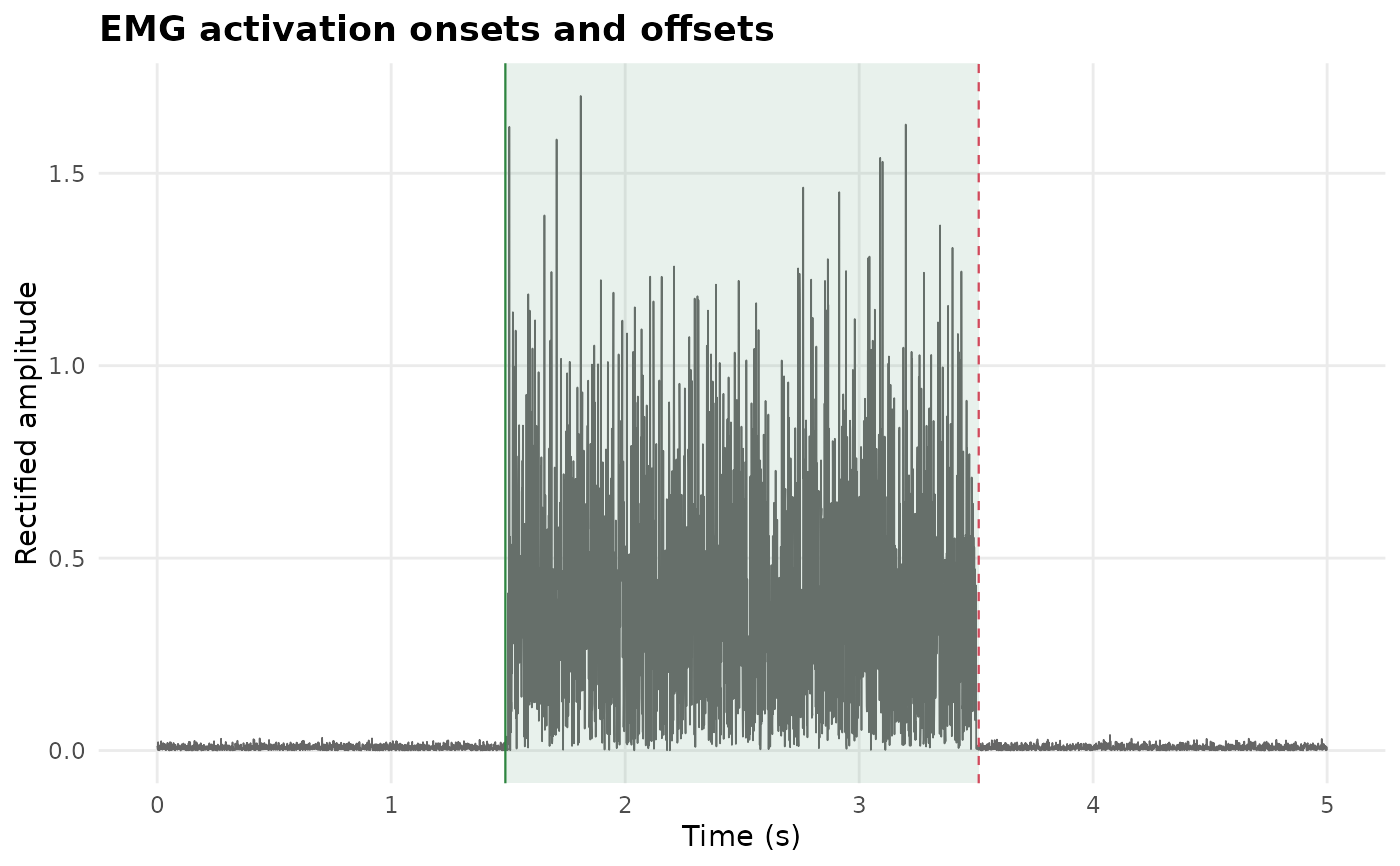
Plots the rectified signal with detected activation intervals shaded and onset/offset times marked.
Arguments
- x
A PhysioExperiment object with EMG data.
- channel
Channel index or label to plot (default: 1).
- method
Onset method passed to
emgOnsetDetect()(default: "hodges_bui").- assay_name
Input assay name (default: first assay).
- ...
Further arguments for
emgOnsetDetect().
References
Hodges, P.W. & Bui, B.H. (1996). "A comparison of computer-based methods for the determination of onset of muscle contraction using electromyography." Electroencephalography and Clinical Neurophysiology, 101(6), 511-519. doi:10.1016/S0921-884X(96)95190-5
Examples
pe <- make_emg_contraction()
plotEmgOnset(pe)