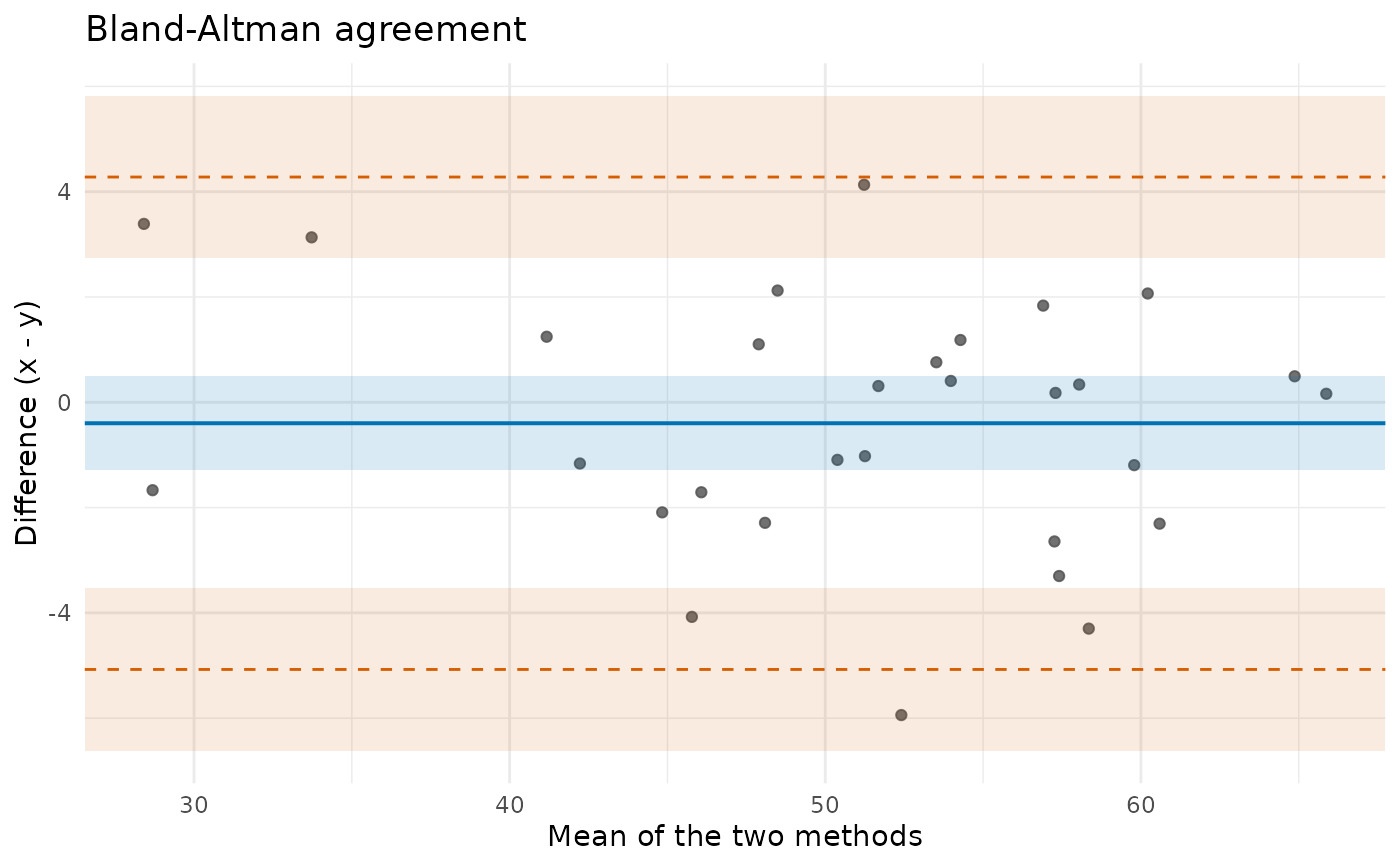
Draws the Bland-Altman difference-vs-mean scatter that
blandAltman only computes: the bias (mean
difference), the upper/lower limits of agreement (LoA), and shaded confidence
bands for the bias and each LoA. The numerics come from blandAltman()
so the plotted reference lines are single-sourced and cannot drift from the
computed statistics.
Usage
plotBlandAltman(
  x,
  y,
  confidence = 0.95,
  proportional_bias = FALSE,
  units = NULL,
  colorblind = TRUE
)
Arguments
- x, y
Numeric vectors of paired measurements (two methods, or two time points). Must be the same length with at least 2 pairs (validated by
blandAltman()).- confidence
Confidence level for the limits of agreement and the shaded confidence bands (default 0.95).
- proportional_bias
Logical. If
TRUE, model the bias and LoA as linear in the mean (Bland-Altman regression): the bias line is the OLS fit of the difference on the mean with a shaded fitted-line confidence band, and the LoA are the fit \(\pm z \cdot s_{resid}\). Use when the difference scales with magnitude. Requires at least 3 pairs (the regression residual variance is undefined at n = 2). DefaultFALSE(constant bias/LoA).- units
Optional measurement unit appended to the axis labels.
- colorblind
Logical; if
TRUE(default) use the ecosystem colorblind-safe palette (physioPalette).
References
Bland JM, Altman DG (1986). Statistical methods for assessing agreement between two methods of clinical measurement. Lancet, 327(8476), 307-310. doi:10.1016/S0140-6736(86)90837-8
See also
PhysioExperiment::blandAltman() for the underlying statistics.