Skip to contents

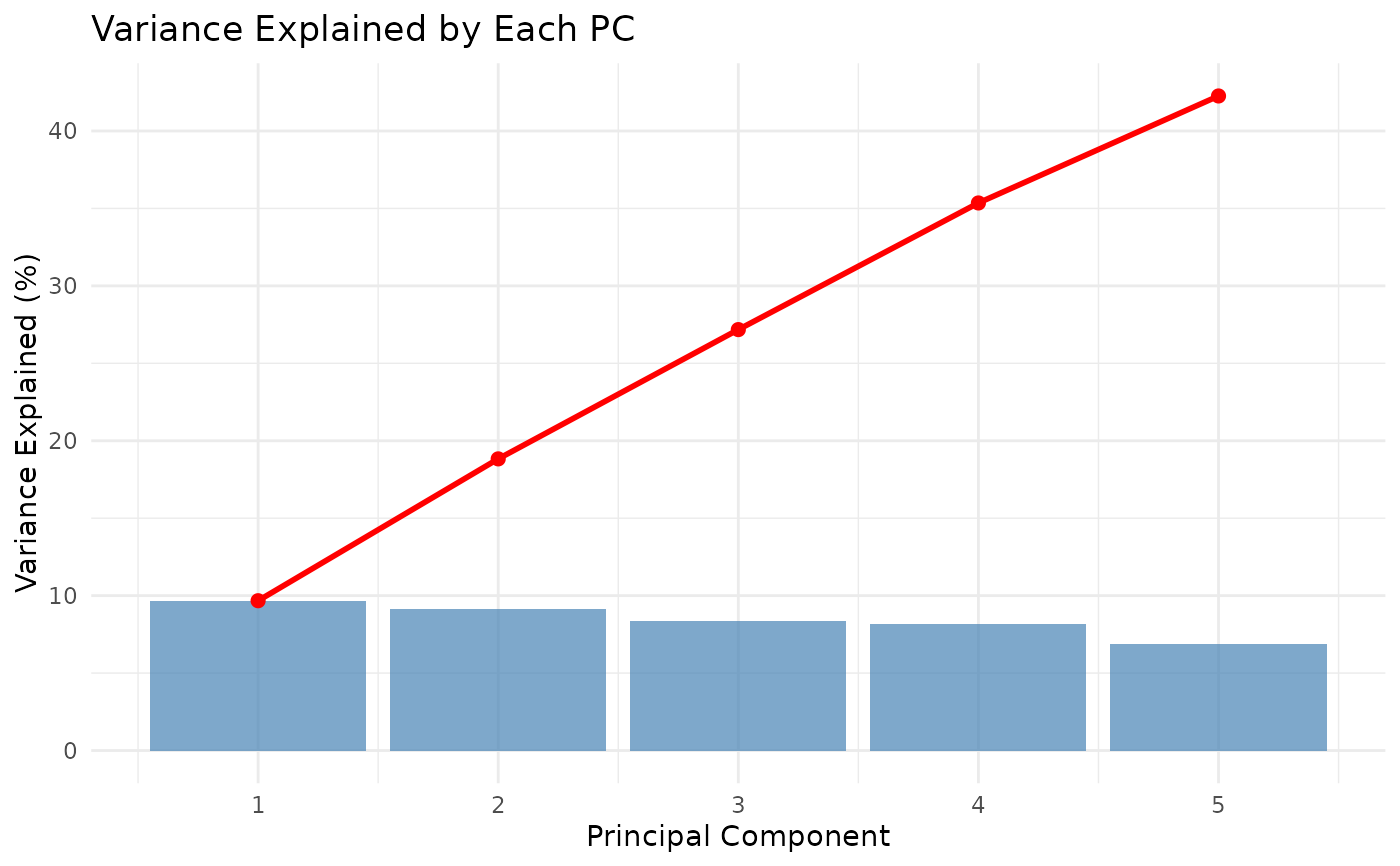
Visualizes functional PCA results including loadings and variance explained.

Usage

plotFPCA(
  x,
  type = c("loadings", "variance", "scores", "all"),
  components = 1:4,
  time_axis = NULL
)

Arguments

x

An fpca_result object.

type

Plot type: "loadings", "variance", "scores", or "all".

components

Which components to plot.

time_axis

Optional time axis values.

Value

A ggplot object (or list of plots for type = "all").

References

Ramsay JO, Silverman BW (2005). "Functional Data Analysis." 2nd ed. Springer.

See also

fPCA() for computing fPCA results, reconstructFPCA() for waveform reconstruction.