Skip to contents

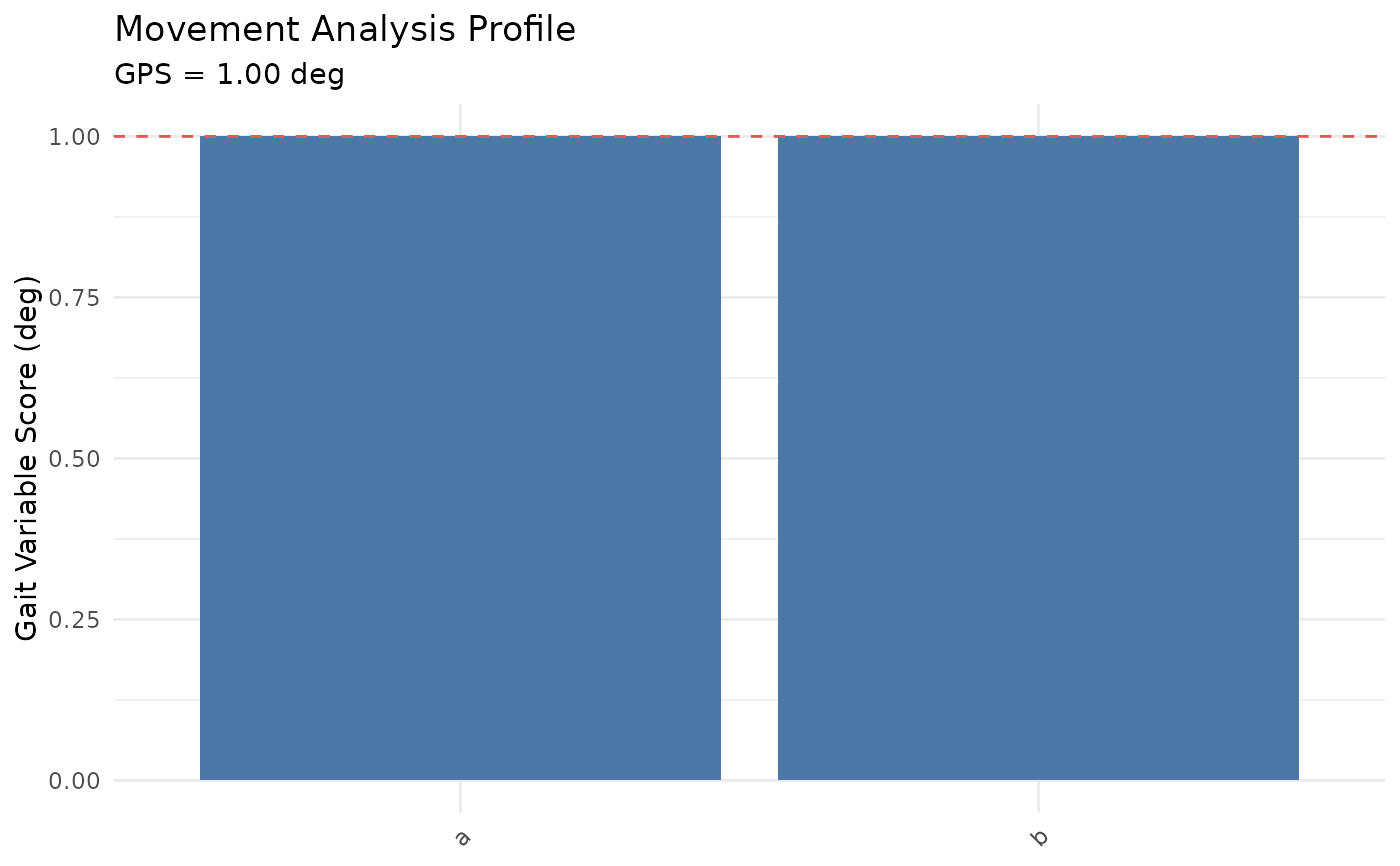
Draws the Movement Analysis Profile (Baker et al. 2009) as a bar chart of the Gait Variable Score for each kinematic variable, with a reference line at the overall Gait Profile Score.

Usage

plotMAP(map, title = "Movement Analysis Profile")

Arguments

map

A movement_analysis_profile object from movementAnalysisProfile().

title

Plot title.

Value

A ggplot object.

Examples

norm <- list(variables = c("a", "b"),
             mean = matrix(0, 2, 51, dimnames = list(c("a", "b"), NULL)),
             cycle_length = 51)
map <- movementAnalysisProfile(
  matrix(1, 2, 51, dimnames = list(c("a", "b"), NULL)), norm)
plotMAP(map)