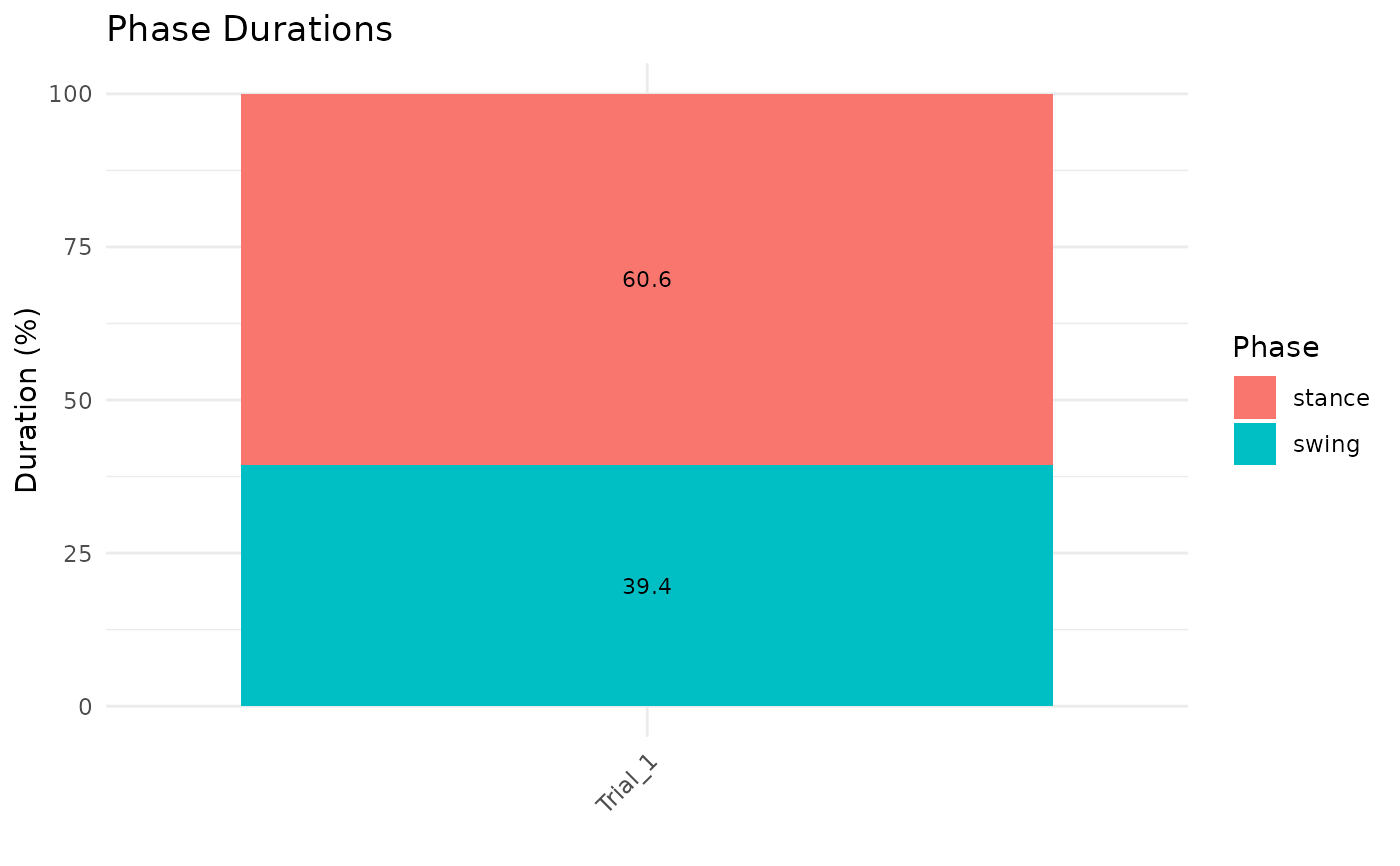
Visualizes phase durations across conditions or groups.
Usage
plotPhaseDurations(
  phases_list,
  labels = NULL,
  unit = c("percent", "seconds"),
  show_values = TRUE,
  title = "Phase Durations",
  ...
)See also
plotCycle() for cycle-normalized waveform visualization,
calculateGaitParameters() for computing gait phase parameters.
Examples
set.seed(123)
data <- matrix(rnorm(200), 100, 2)
events <- data.frame(
  event = c("hs1","ff","ms","ho","to","hs2"),
  label = c("Heel Strike","Foot Flat","Midstance","Heel Off","Toe Off","Heel Strike 2"),
  index = c(1, 13, 31, 41, 61, 100), time = c(0, .12, .30, .40, .60, 1.0),
  percent = c(0, 12, 30, 40, 60, 100), method = rep("manual", 6),
  confidence = rep(1, 6), stringsAsFactors = FALSE)
class(events) <- c("detected_events", "data.frame")
attr(events, "sampling_rate") <- 100
phases <- segmentPhases(data, events, schema_gait)
plotPhaseDurations(list(phases))