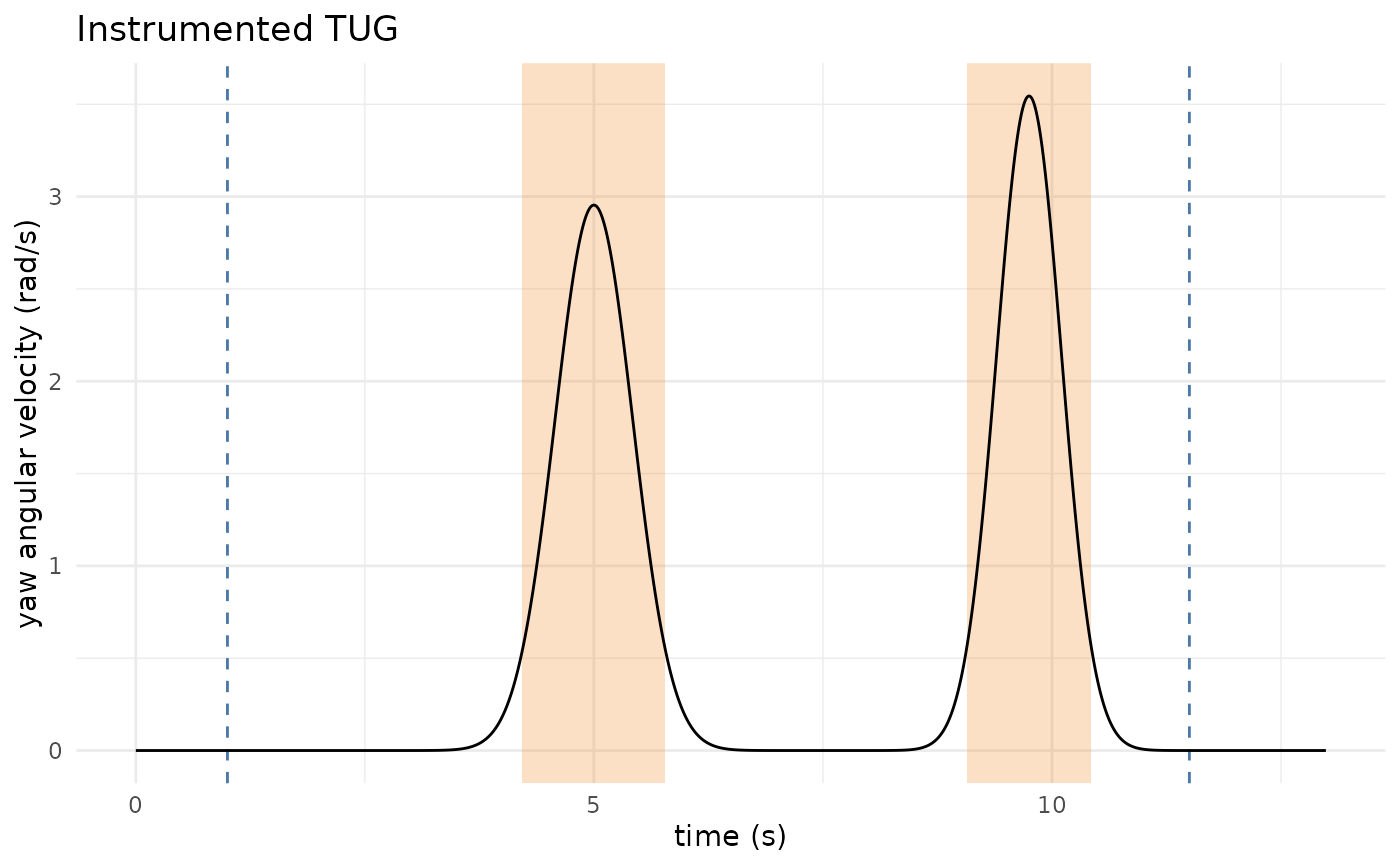
Plots the trunk yaw angular velocity with the detected turns shaded and the sit-to-stand / turn-to-sit transitions marked.
Arguments
- report
An
itug_reportfrominstrumentedTUG().- title
Plot title.
Examples
fs <- 100
t <- (0:(13 * fs - 1)) / fs
g <- function(t, mu, s) exp(-((t - mu) / s)^2)
yaw <- (pi / (0.6 * sqrt(pi))) * g(t, 5, 0.6) +
       (pi / (0.5 * sqrt(pi))) * g(t, 9.75, 0.5)
pitch <- 1.5 * g(t, 1, 0.3) + 1.3 * g(t, 11.5, 0.3)
av <- cbind(0.05 * sin(2 * pi * t), pitch, yaw)
plotTUG(instrumentedTUG(av, fs))