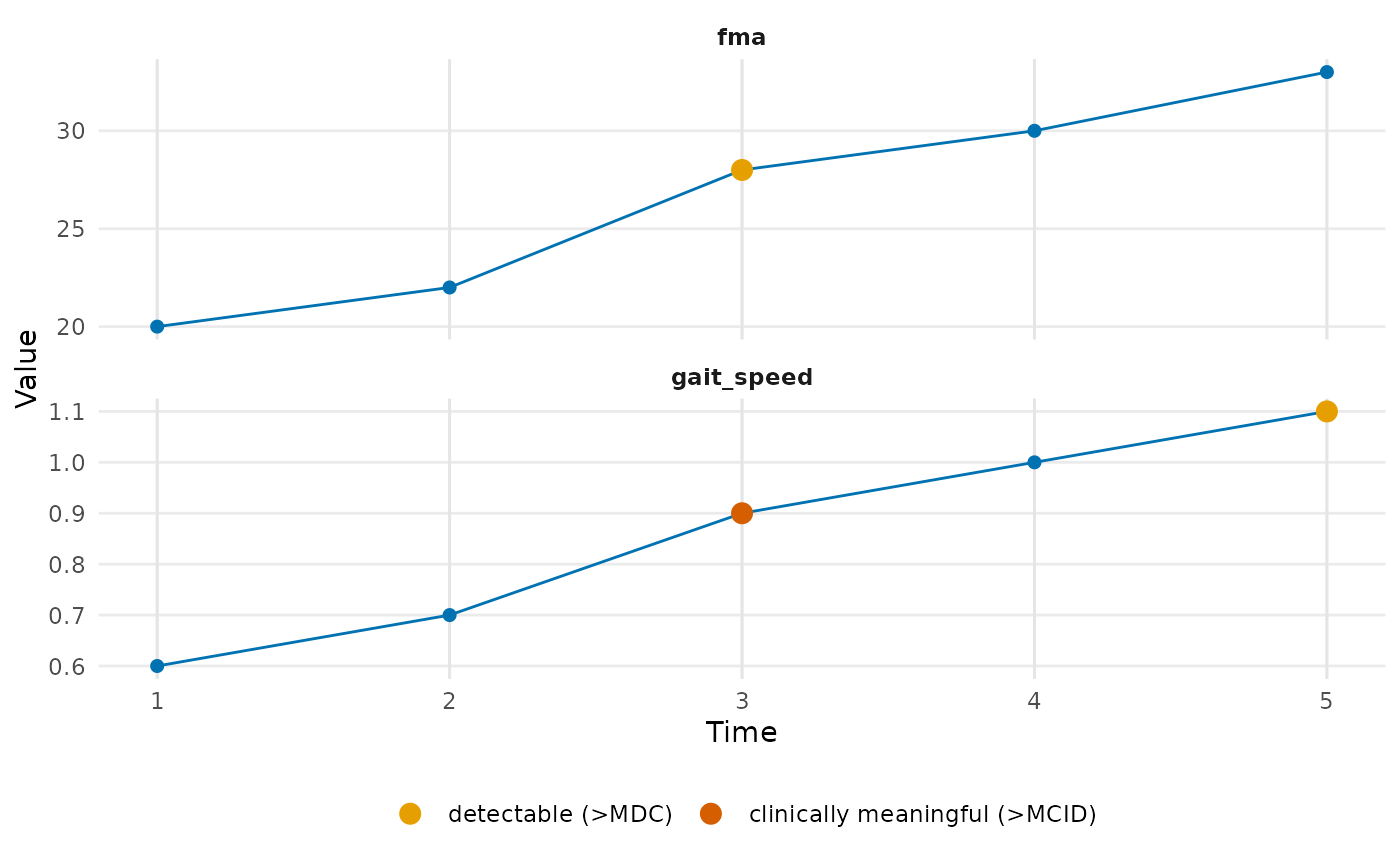
Draws a longitudinal rehabilitation timeline: each outcome measure is a
stacked lane showing its trajectory across sessions, intervention periods are
shaded spans across all lanes, and points where the session-to-session change
crosses the Minimal Detectable Change / Minimal Clinically Important Difference
are marked (via annotateChange).
Arguments
- sessions
A
data.frameof session timepoints with atimecolumn (numeric orDate) and an optionallabel; drawn as light session reference lines.- interventions
Optional
data.frameof intervention periods withstartandendcolumns (and an optionallabel); drawn as shaded spans behind every lane.- outcomes
A long
data.frameof outcome measurements with columnstime,metricandvalue(one lane permetric).- mdc, mcid
Optional MDC / MCID thresholds used to flag crossings: a scalar applied to all metrics, or a value named by metric. Both must be supplied to draw crossing markers.
Examples
sessions <- data.frame(time = 1:5)
outcomes <- data.frame(time = rep(1:5, 2),
  metric = rep(c("gait_speed", "fma"), each = 5),
  value = c(0.6, 0.7, 0.9, 1.0, 1.1, 20, 22, 28, 30, 33))
longitudinalTimeline(sessions, outcomes = outcomes,
  mdc = c(gait_speed = 0.1, fma = 5), mcid = c(gait_speed = 0.15, fma = 9))