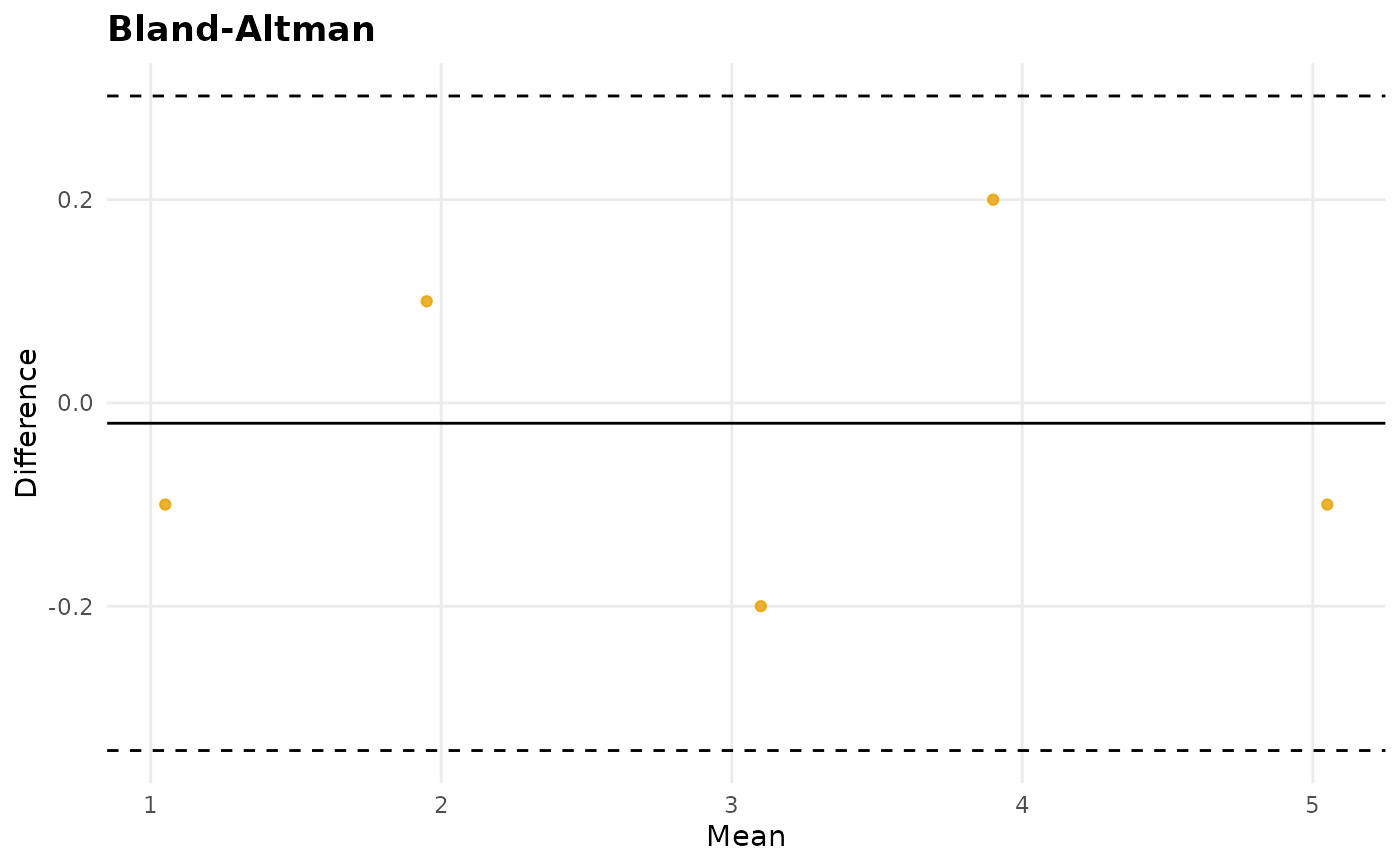
Draws a Bland-Altman plot (mean vs. difference of paired measurements) with
bias and limit-of-agreement reference lines. The statistics come from
PhysioExperiment::blandAltman(), so the plotted lines exactly match the
computed bias and limits of agreement.
Usage
plotBlandAltman(x, y, confidence = 0.95)
Arguments
- x, y
Numeric vectors of paired measurements (e.g. two methods, or
baseline vs follow-up).
- confidence
Confidence level for the limits of agreement (default 0.95).
Examples
plotBlandAltman(c(1, 2, 3, 4, 5), c(1.1, 1.9, 3.2, 3.8, 5.1))