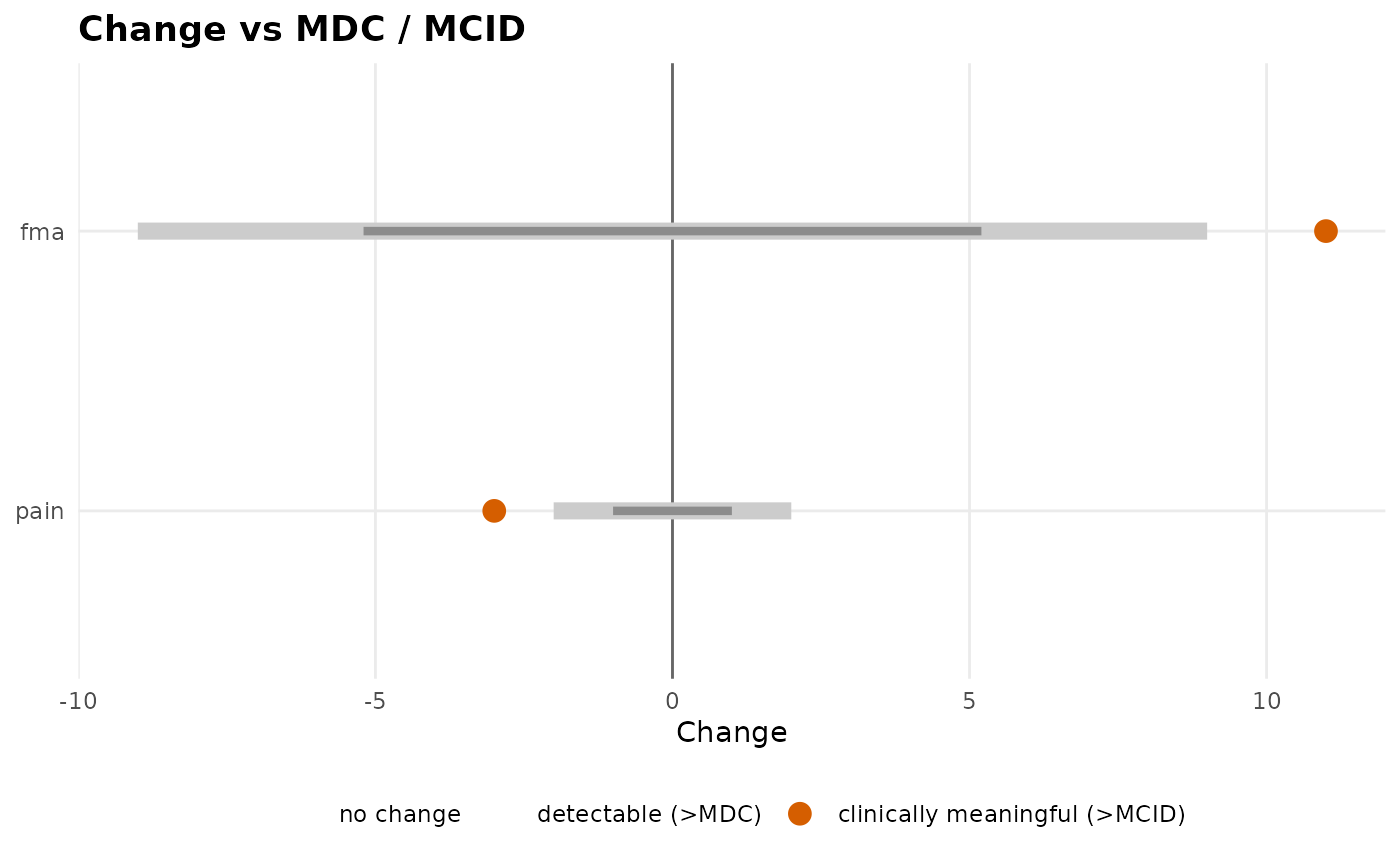
Forest-style plot of annotated pre-to-post changes
Source:R/change-annotate.R
plotChangeAnnotated.RdDraws one row per metric showing the signed change as a point, with the \(\pm\)MDC and \(\pm\)MCID thresholds as symmetric reference bands around the no-change line, coloured by the change classification.
Arguments
- changes
A
"change_annotation"object fromannotateChange.