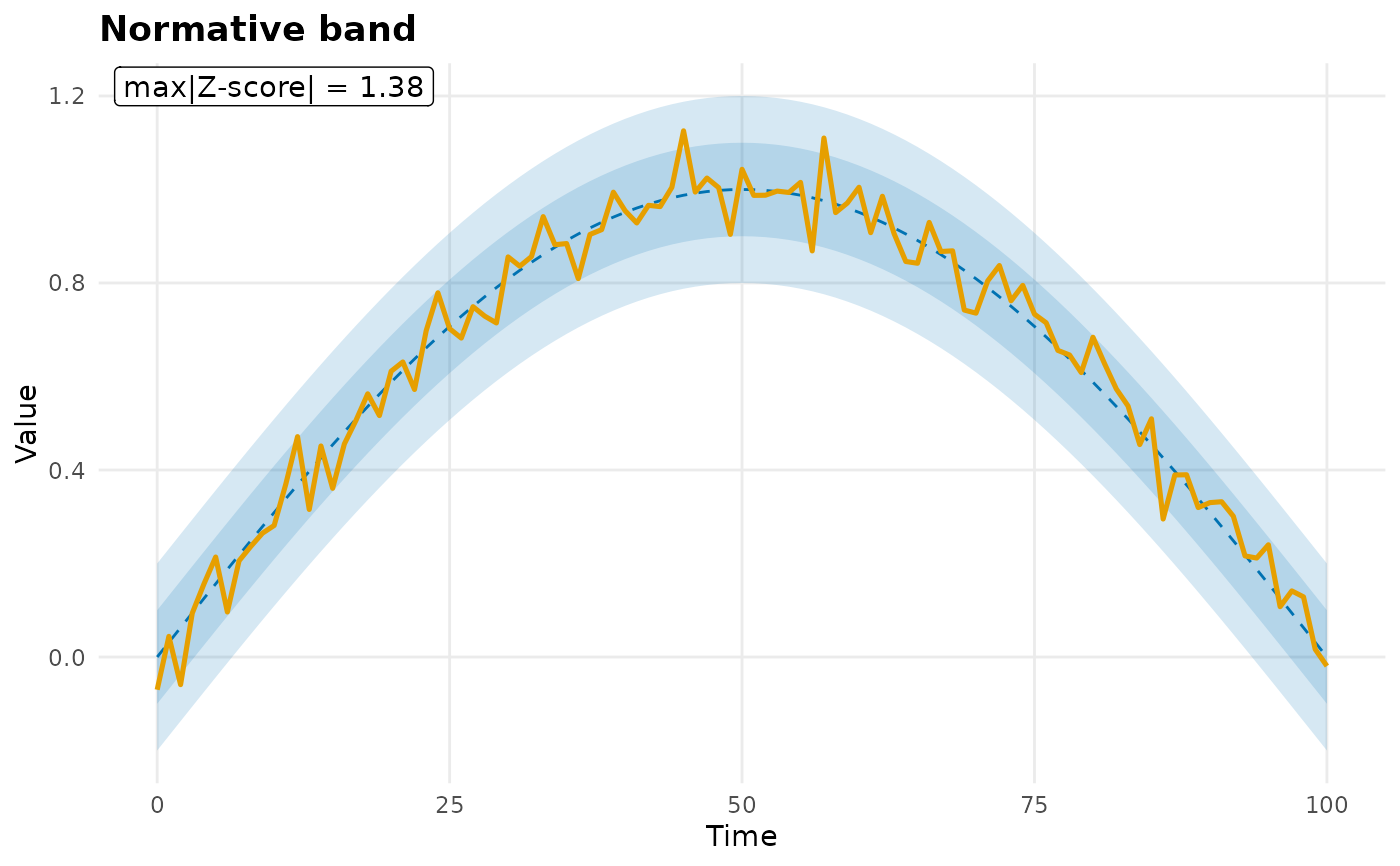
Draws a normative corridor as graded \(\pm1\)SD and \(\pm2\)SD ribbons around the reference median, overlays the observed trajectory, and annotates the z-score. Uses the ecosystem colorblind-safe palette and report theme.
Usage
plotNormativeBand(
  observed = NULL,
  model,
  bands = c(1, 2),
  time_axis = NULL,
  annotate_z = TRUE,
  age = NULL,
  sex = NULL,
  task = NULL,
  ...
)
Arguments
- observed
Numeric observation (a waveform, or a scalar broadcast across the corridor).
NULLdraws just the corridor (no observed line and no z annotation), so callers can overlay their own traces (e.g. left/right); for a scalar model this requirestime_axisto set the x extent.- model
- bands
Numeric vector of SD multiples to shade (default
c(1, 2)); onegeom_ribbonlayer per band, widest drawn first.- time_axis
Optional numeric x-axis; defaults to the model's
timeor the sample index.- annotate_z
Logical; if
TRUE(default) annotate the (max absolute) z-score.- age, sex, task
Optional strata forwarded to the model.
- ...
Currently unused (reserved for future styling arguments).