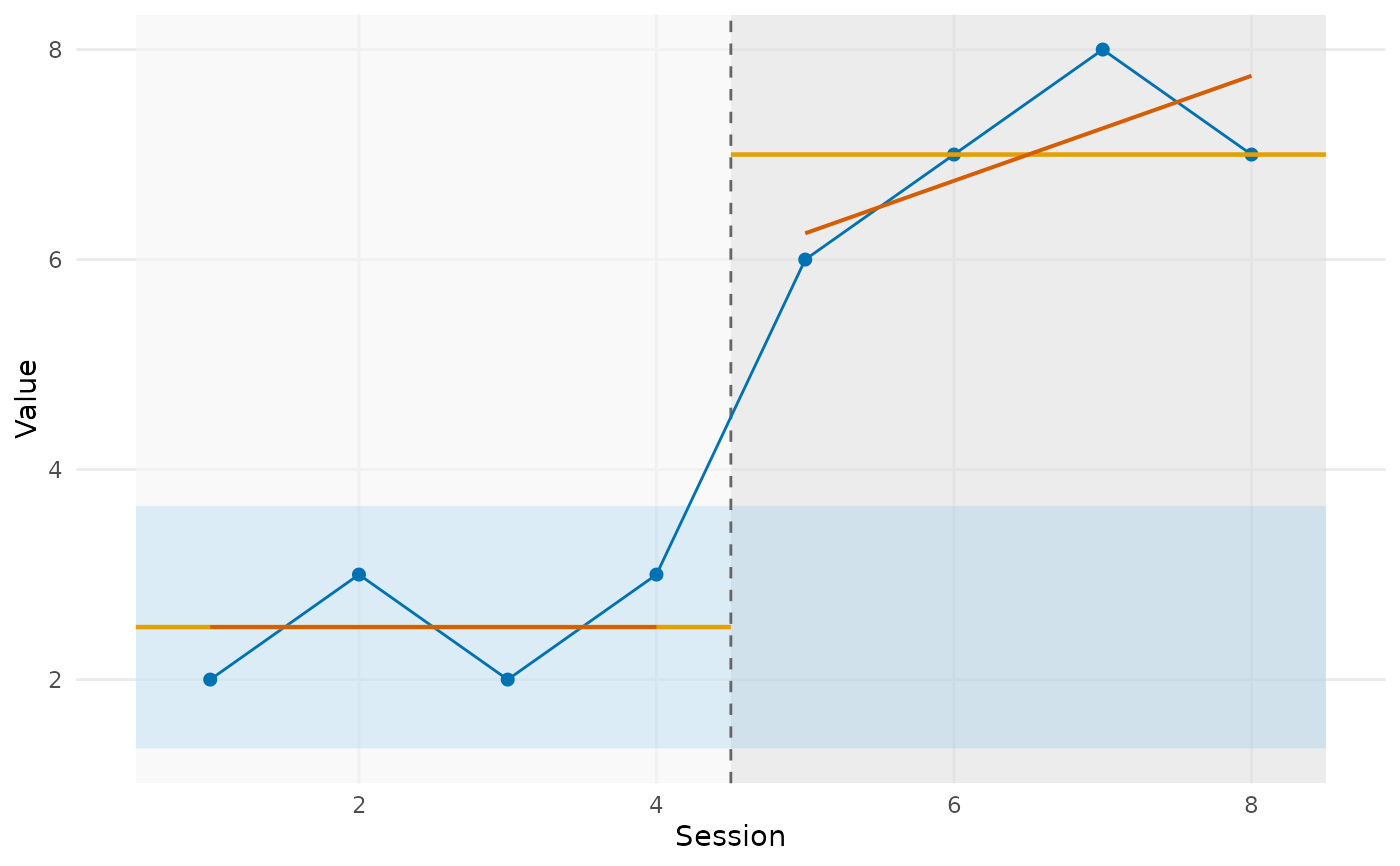
Plots a single-subject time series with SCED-standard overlays: shaded phase panels, phase-change reference lines, per-phase mean lines, the baseline \(\pm\)2SD band, and per-phase split-middle celeration (trend) lines.
Usage
plotSCED(data, phase, overlays = c("mean", "2SD", "celeration"))Arguments
- data
Numeric vector of observations, in session order.
- phase
Vector of phase labels (e.g.
"A"/"B") the same length asdata; phases are drawn in order of first appearance.- overlays
Which overlays to draw: any of
"mean"(per-phase mean lines),"2SD"(baseline mean \(\pm\)2SD band) and"celeration"(split-middle trend lines). Default: all three.
References
Kratochwill TR et al. (2010). Single-case designs technical documentation (What Works Clearinghouse).