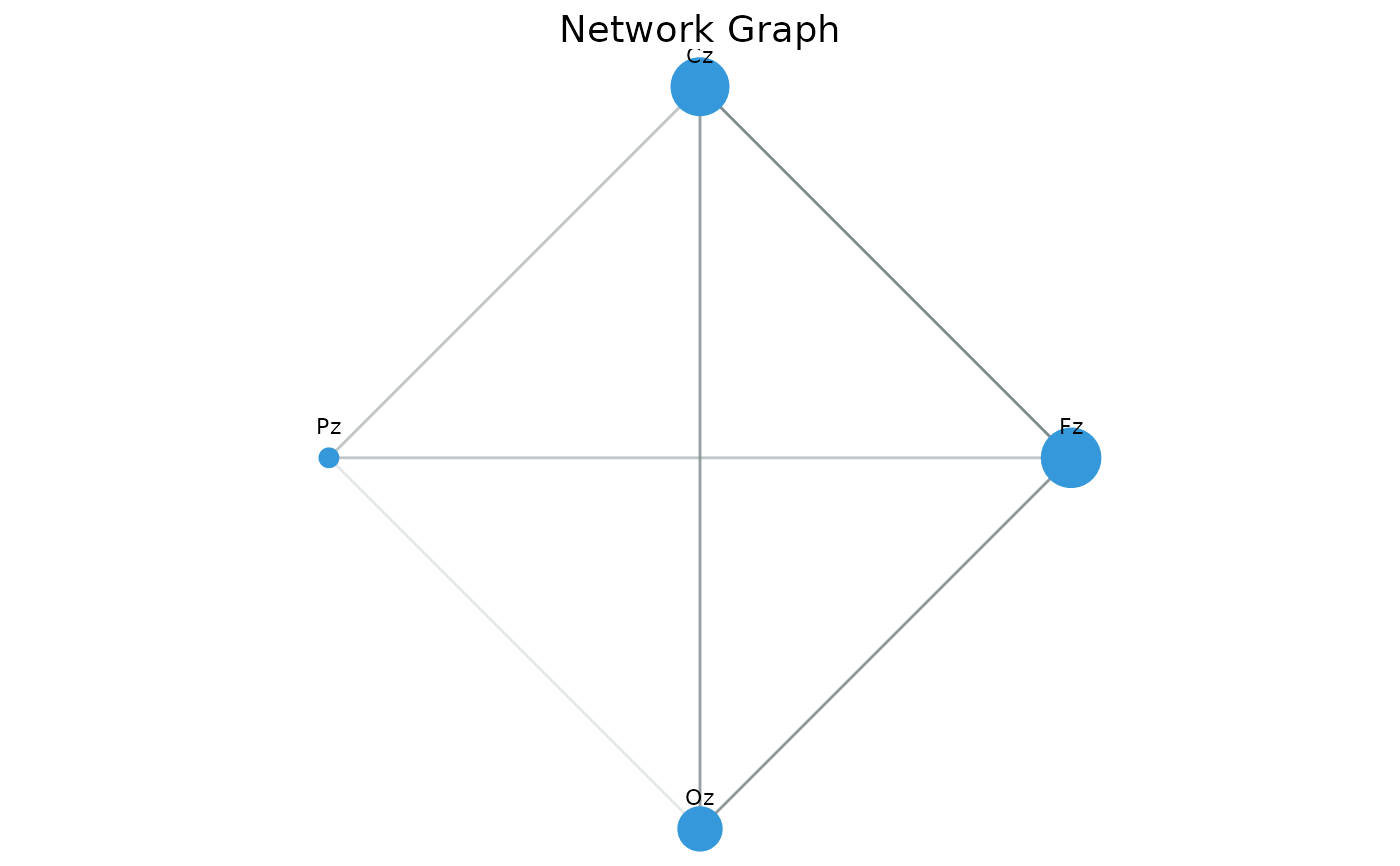
Functions for visualizing functional connectivity networks including network graphs, adjacency matrices, and network metrics. Plot network graph
Usage
plotNetwork(
  adjacency,
  node_names = NULL,
  node_size = "degree",
  edge_threshold = 0,
  layout = c("circle", "spring", "grid"),
  node_color = "#3498db",
  edge_color = "#7f8c8d",
  title = "Network Graph"
)
Arguments
- adjacency
An adjacency matrix or connectivity result.
- node_names
Optional vector of node names.
- node_size
Node size. Can be "degree", "betweenness", "eigenvector", or numeric.
- edge_threshold
Minimum edge weight to display.
- layout
Layout algorithm: "circle", "spring", or "grid".
- node_color
Node color or vector of colors.
- edge_color
Edge color.
- title
Plot title.