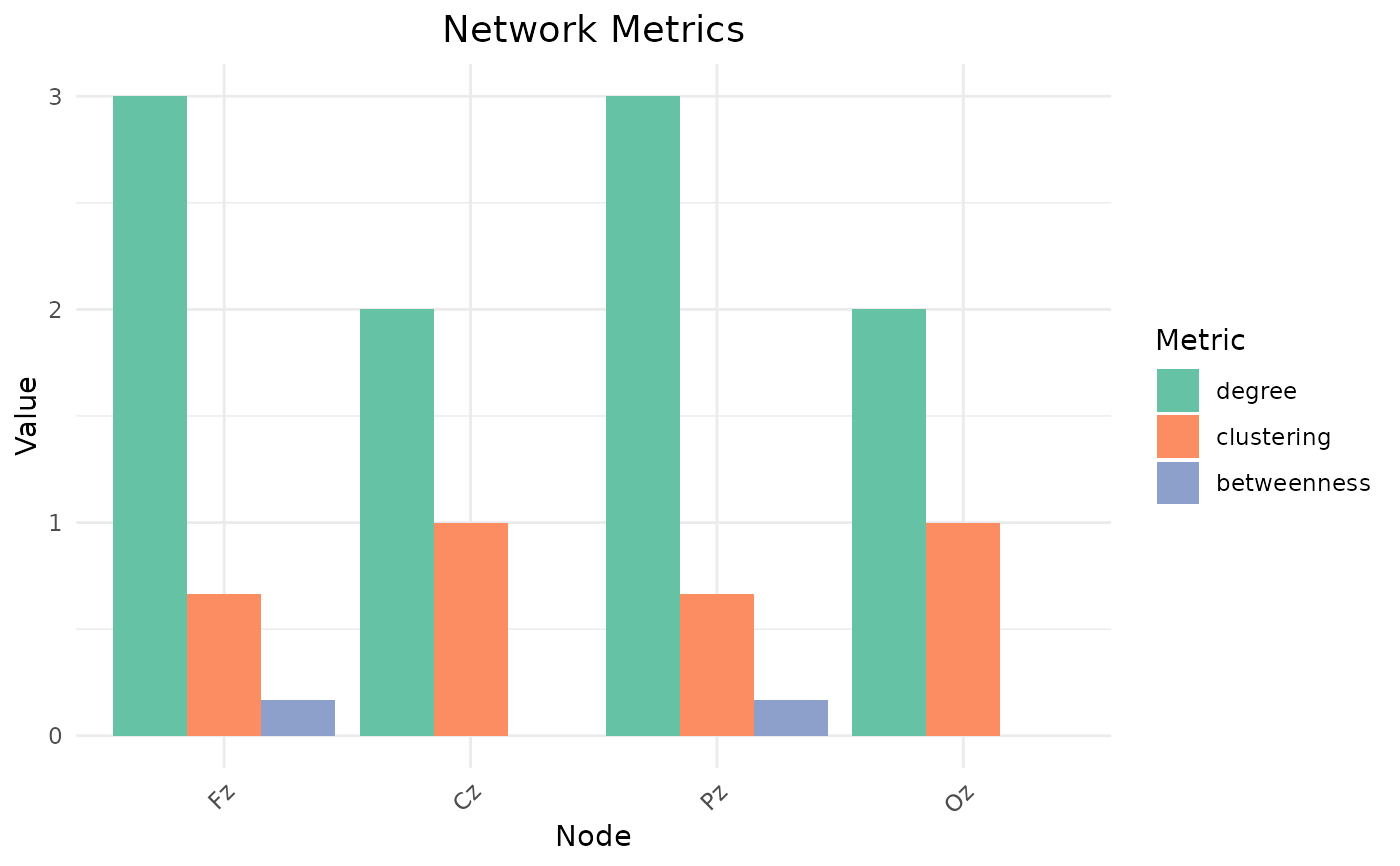
Creates a bar plot of network metrics for each node.
Usage
plotNetworkMetrics(
  adjacency,
  metrics = c("degree", "clustering", "betweenness"),
  node_names = NULL,
  title = "Network Metrics"
)Creates a bar plot of network metrics for each node.
plotNetworkMetrics(
adjacency,
metrics = c("degree", "clustering", "betweenness"),
node_names = NULL,
title = "Network Metrics"
)