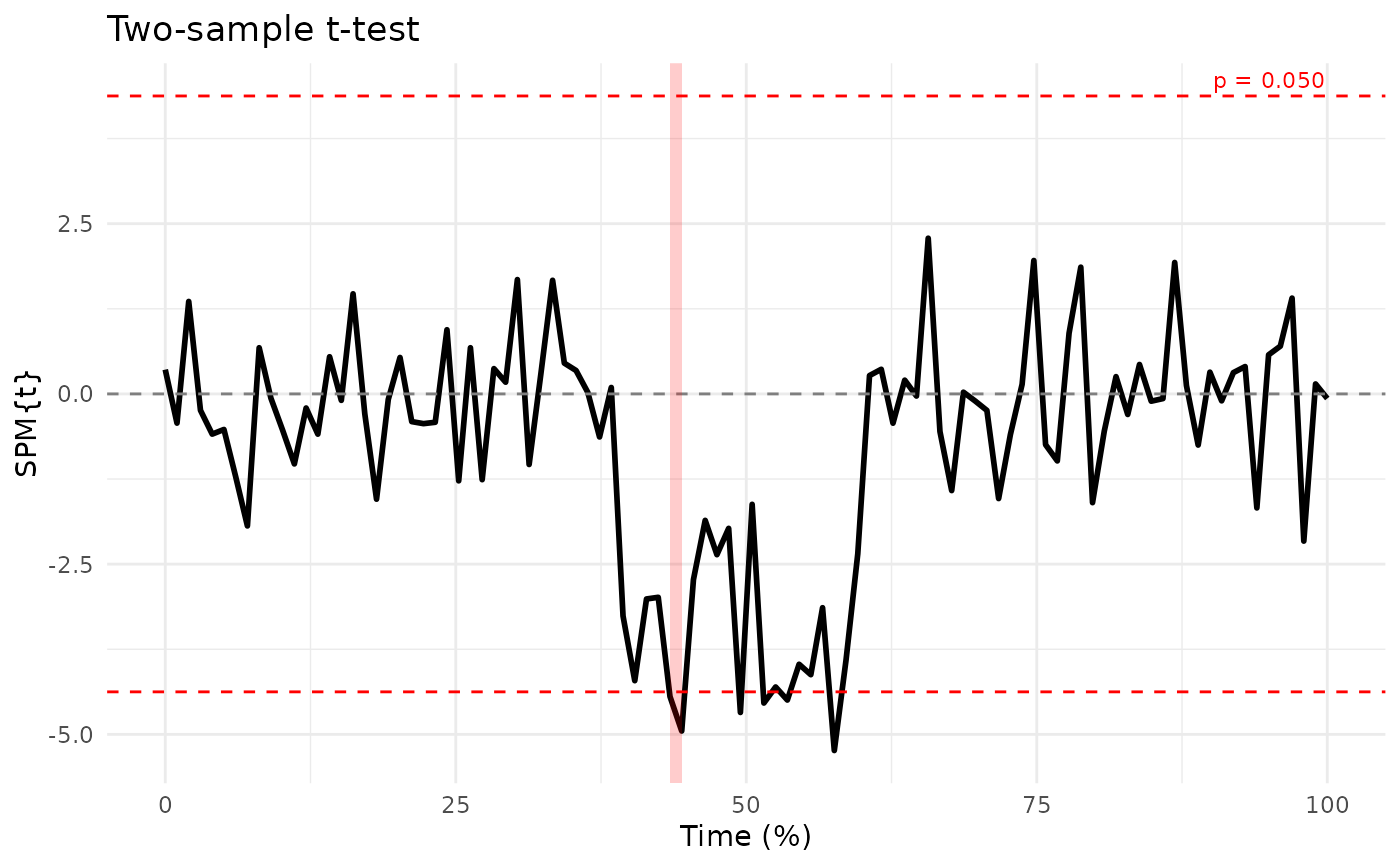
Visualizes SPM analysis results with significance thresholds.
Examples
# Create and plot SPM result
set.seed(123)
g1 <- matrix(rnorm(100 * 10), nrow = 100)
g2 <- matrix(rnorm(100 * 10), nrow = 100)
g2[40:60, ] <- g2[40:60, ] + 1.5

pe <- PhysioExperiment(
  assays = list(values = cbind(g1, g2)),
  samplingRate = 100
)
result <- spmTTest(pe, group1 = 1:10, group2 = 11:20)
plotSPM(result)