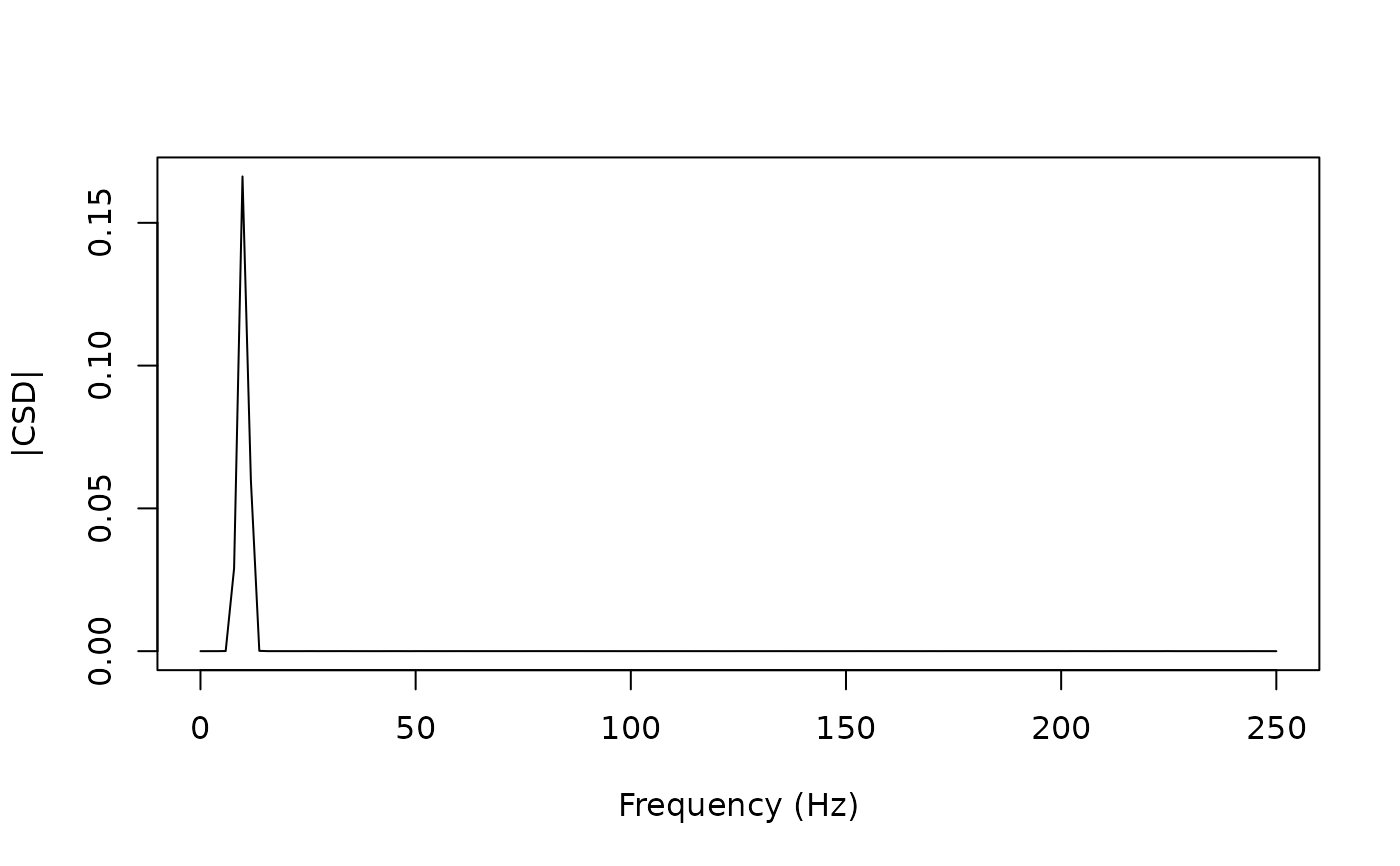
Computes the cross-spectral density (CSD) between two signals using Welch's method. The CSD captures both the magnitude and phase relationship between two signals as a function of frequency.
Usage
crossSpectrum(
  x,
  y = NULL,
  sr = NULL,
  nperseg = 256L,
  noverlap = NULL,
  modality_x = NULL,
  modality_y = NULL,
  channels_x = 1L,
  channels_y = 1L
)
Arguments
- x
Numeric vector, PhysioExperiment, or MultiPhysioExperiment.
- y
Numeric vector or PhysioExperiment, or NULL when
xis an MPE.- sr
Numeric sampling rate in Hz (required when x/y are numeric).
- nperseg
Integer segment length for Welch's method (default 256).
- noverlap
Integer overlap between segments, or NULL for
floor(nperseg / 2).- modality_x
Character modality name in MPE for the x signal.
- modality_y
Character modality name in MPE for the y signal.
- channels_x
Integer which channel to extract from x (default 1).
- channels_y
Integer which channel to extract from y (default 1).
Value
A named list with components:
- csd
Complex vector of cross-spectral density values.
- frequencies
Numeric vector of corresponding frequencies in Hz.
- magnitude
Numeric vector of CSD magnitude (
Mod(csd)).- phase
Numeric vector of CSD phase in radians (
Arg(csd)).
References
Carter, G. C. (1987). Coherence and time delay estimation. Proceedings of the IEEE, 75(2), 236–255.
Halliday, D. M., Rosenberg, J. R., Amjad, A. M., Breeze, P., Conway, B. A., & Farmer, S. F. (1995). A framework for the analysis of mixed time series/point process data – theory and application to the study of physiological tremor, single motor unit discharges and electromyograms. Progress in Biophysics and Molecular Biology, 64(2–3), 237–278.