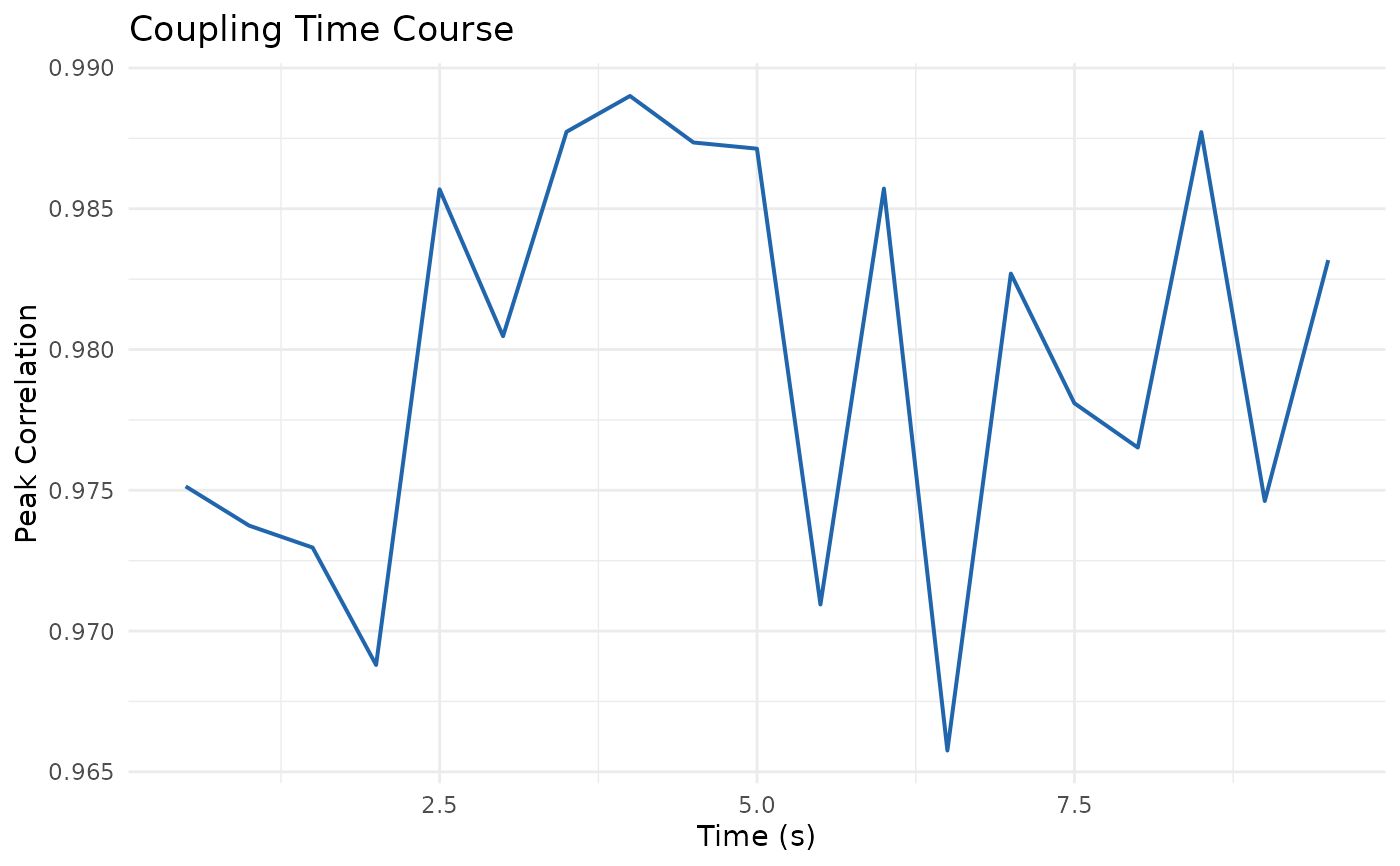
Plot time-varying coupling from sliding-window analysis
Source:R/vis-coupling.R
plotCouplingTimecourse.RdDisplays the peak cross-correlation over time from the result of
slidingCrossCorrelation.
Arguments
- result
A list returned by
slidingCrossCorrelation, containing at least$timesand$peak_correlations.- title
Character string for the plot title (default
"Coupling Time Course").- ...
Additional arguments (currently unused).
References
Wickham, H. (2016). ggplot2: Elegant Graphics for Data Analysis. Springer-Verlag New York. doi:10.1007/978-3-319-24277-4
Examples
sr <- 500
set.seed(1)
x <- rnorm(5000)
y <- c(rep(0, 10), x[1:4990])
res <- slidingCrossCorrelation(x, y, sr = sr,
                                window_sec = 1, step_sec = 0.5)
if (requireNamespace("ggplot2", quietly = TRUE)) {
  plotCouplingTimecourse(res)
}