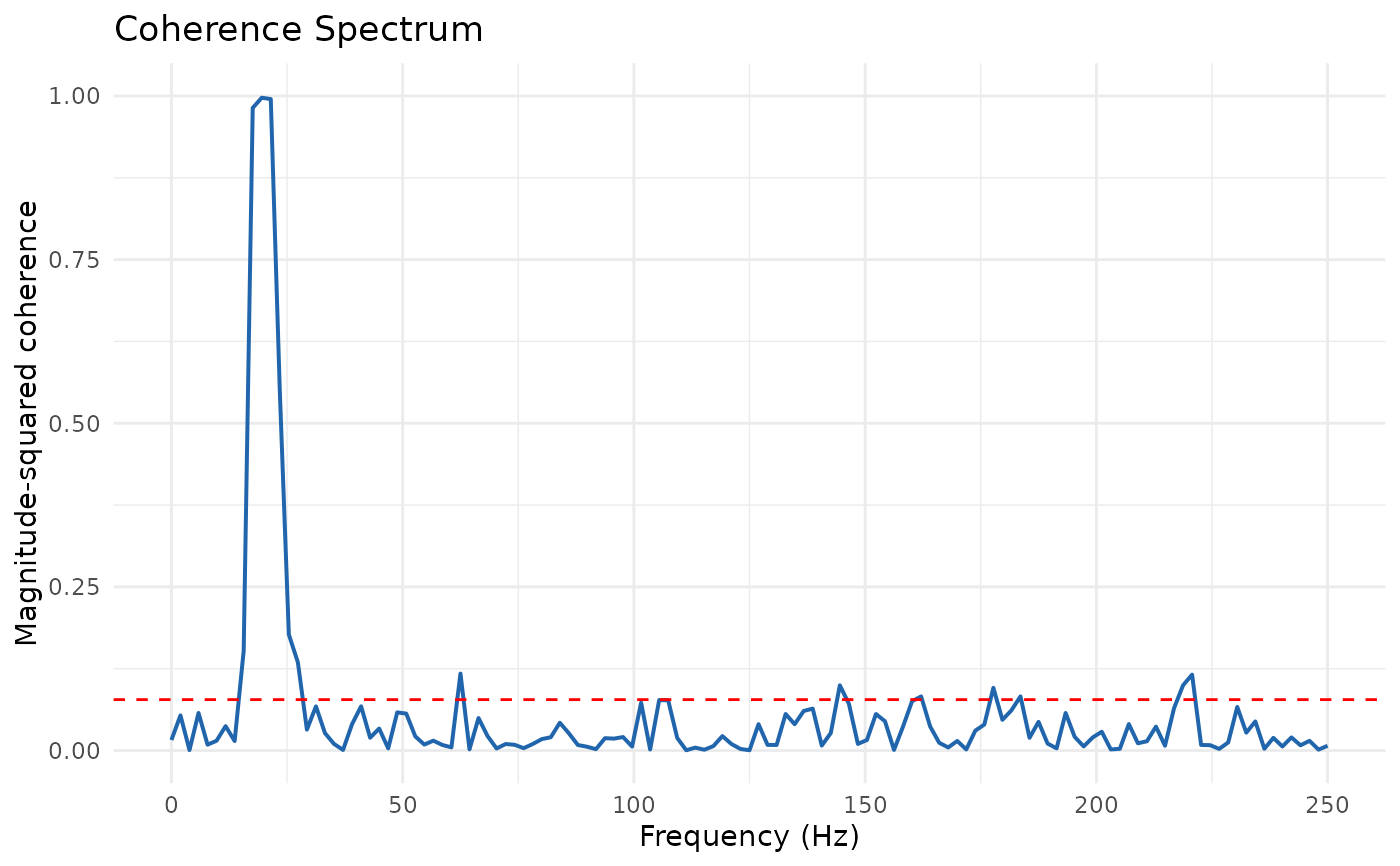
Displays the coherence as a function of frequency from the result of
coherence. Optionally draws the 95\
a horizontal dashed line.
Arguments
- result
A list returned by
coherence, containing at least$coherenceand$frequencies. If$confidence_limitis present it is drawn as a threshold line.- show_threshold
Logical; if TRUE (default) and a confidence limit is available, draw it on the plot.
- title
Character string for the plot title (default
"Coherence Spectrum").- ...
Additional arguments (currently unused).
References
Wickham, H. (2016). ggplot2: Elegant Graphics for Data Analysis. Springer-Verlag New York. doi:10.1007/978-3-319-24277-4