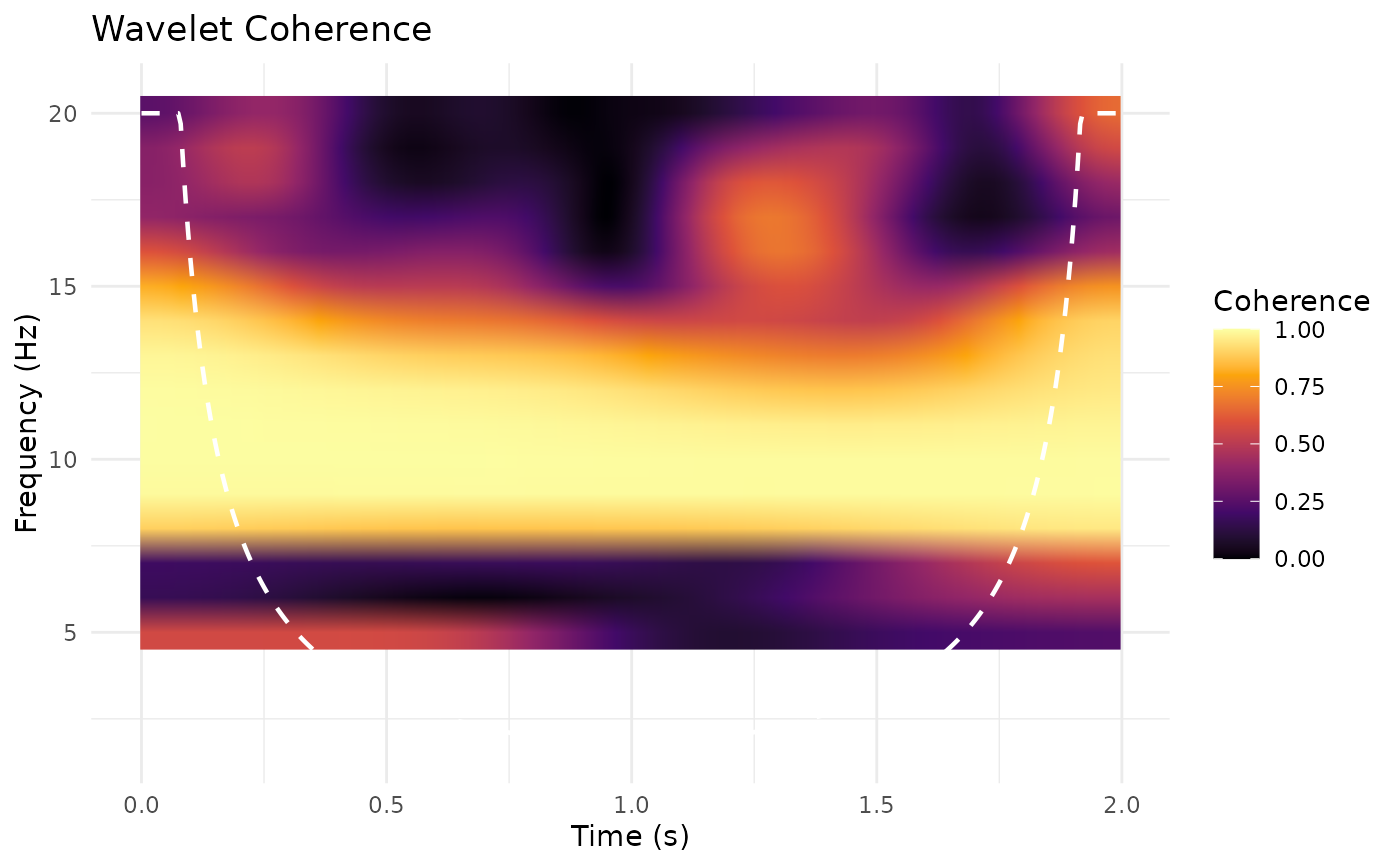
Displays wavelet coherence (or wavelet PLV) as a filled time-frequency heatmap with optional Cone of Influence (COI) overlay.
Usage
plotWaveletCoherence(
  result,
  show_coi = TRUE,
  title = "Wavelet Coherence",
  fill_label = "Coherence",
  ...
)
Arguments
- result
List returned by
waveletCoherenceorwaveletPLV.- show_coi
Logical; overlay COI boundary (default
TRUEifcoiis present in the result).- title
Character plot title (default
"Wavelet Coherence").- fill_label
Character legend label (default
"Coherence").- ...
Additional arguments passed to
ggplot2::theme().
References
Wickham, H. (2016). ggplot2: Elegant Graphics for Data Analysis. Springer-Verlag New York. doi:10.1007/978-3-319-24277-4
Examples
sr <- 200
t <- seq(0, 2, length.out = sr * 2)
x <- sin(2 * pi * 10 * t) + 0.3 * rnorm(length(t))
y <- 0.8 * sin(2 * pi * 10 * t) + 0.3 * rnorm(length(t))
result <- waveletCoherence(x, y, sr = sr, frequencies = seq(5, 20))
if (requireNamespace("ggplot2", quietly = TRUE)) {
  plotWaveletCoherence(result)
}