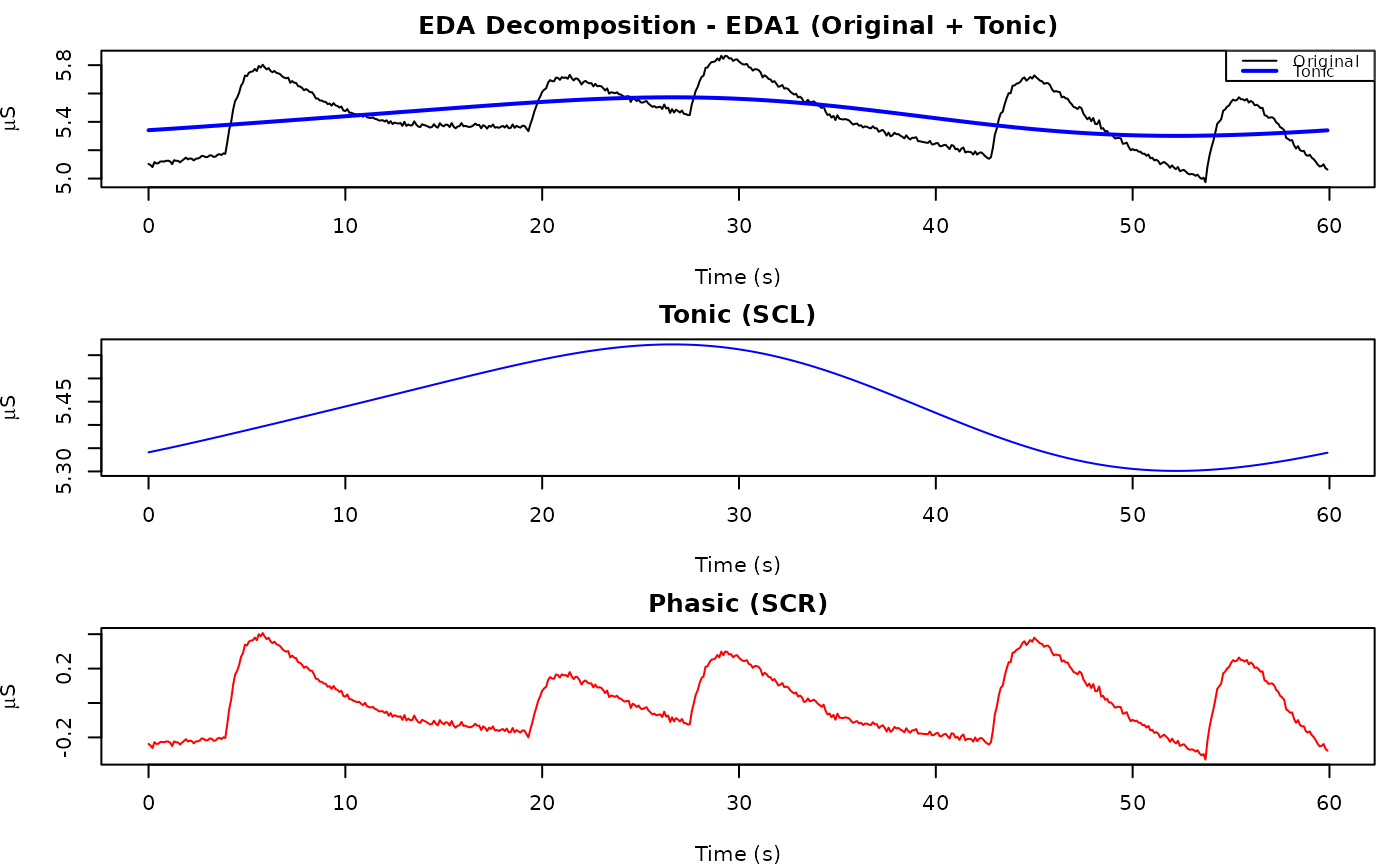
Displays the tonic/phasic decomposition of an EDA signal in a multi-panel
layout. Requires that edaDecompose() has been run first so that
"tonic" and "phasic" assays exist.
Arguments
- x
A PhysioExperiment object with tonic and phasic assays.
- channel
Integer or character specifying which channel to plot (default: 1).
- time_range
Numeric vector of length 2 giving start and end times in seconds. If NULL, the full signal is plotted.
- main
Character string for the overall plot title (default: "EDA Decomposition").
- ...
Additional arguments passed to
plot().
References
Boucsein, W. (2012). Electrodermal Activity. 2nd ed. Springer. doi:10.1007/978-1-4614-1126-0
See also
plotEda for basic EDA time series plotting,
edaDecompose for performing the decomposition,
plotPeaks for SCR peak visualization
Examples
x <- edaSimulate(n_time = 600, sr = 10, seed = 1)
x <- edaDecompose(x)
plotDecompose(x)