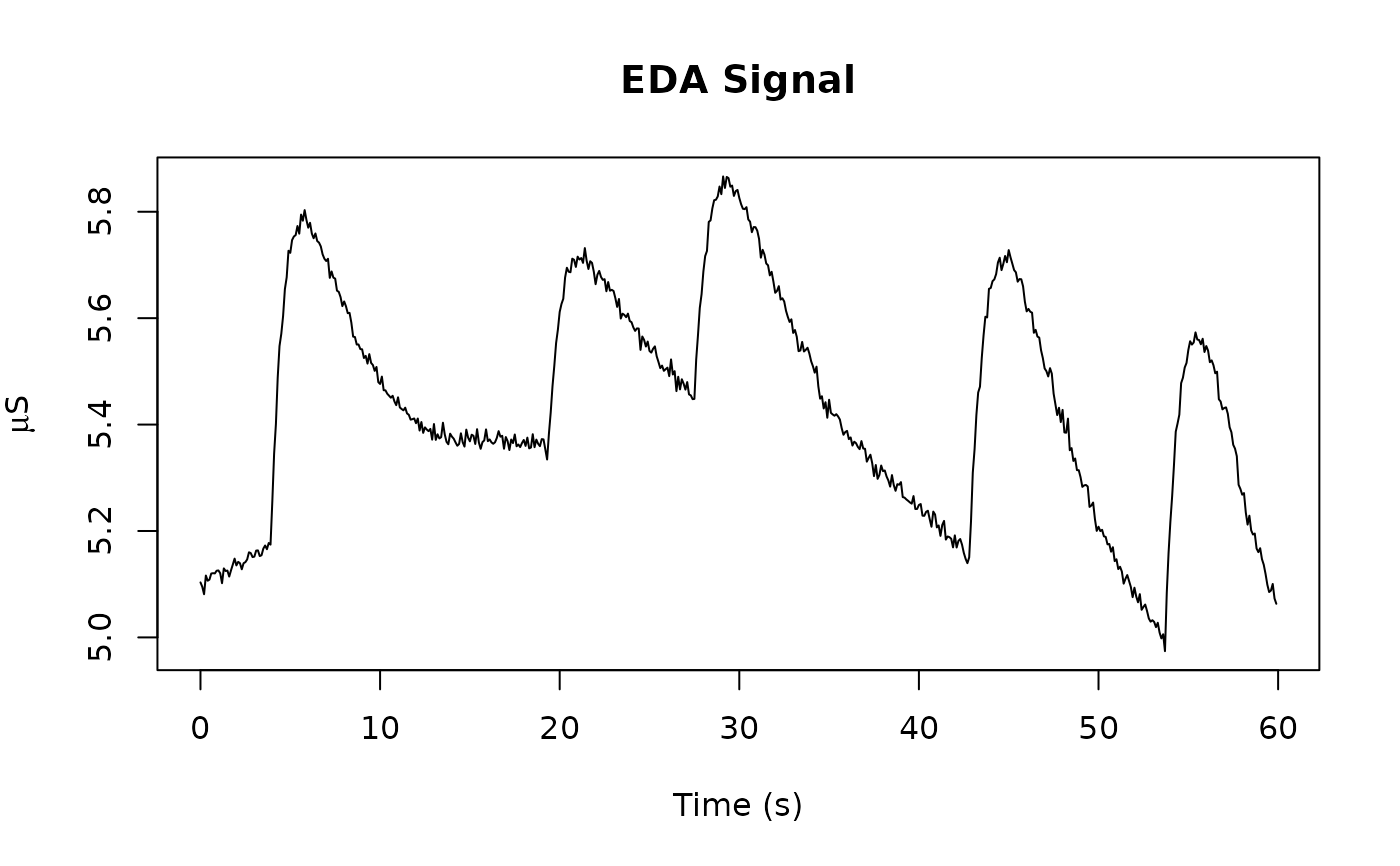
Plots electrodermal activity signals as time series using base R graphics. Multiple channels are displayed in stacked panels. Optionally overlays vertical event markers.
Usage
plotEda(
  x,
  channels = NULL,
  time_range = NULL,
  assay_name = NULL,
  show_events = TRUE,
  main = "EDA Signal",
  col = NULL,
  ...
)
Arguments
- x
A PhysioExperiment object containing EDA data.
- channels
Integer or character vector specifying which channels to plot. If NULL (default), all channels are plotted.
- time_range
Numeric vector of length 2 giving start and end times in seconds for zooming (e.g.,
c(10, 30)). If NULL, the full signal is plotted.- assay_name
Name of the assay to plot. If NULL, uses
defaultAssay(x).- show_events
Logical; if TRUE (default) and events exist, draws vertical dashed lines at event onsets.
- main
Character string for the plot title (default: "EDA Signal").
- col
Vector of colors for the channels. If NULL, uses default palette.
- ...
Additional arguments passed to
plot().
References
Boucsein, W. (2012). Electrodermal Activity. 2nd ed. Springer. doi:10.1007/978-1-4614-1126-0
See also
plotDecompose for decomposition visualization,
plotPeaks for SCR peak visualization,
edaDecompose for tonic/phasic decomposition
Examples
x <- edaSimulate(n_time = 600, sr = 10, seed = 1)
plotEda(x)