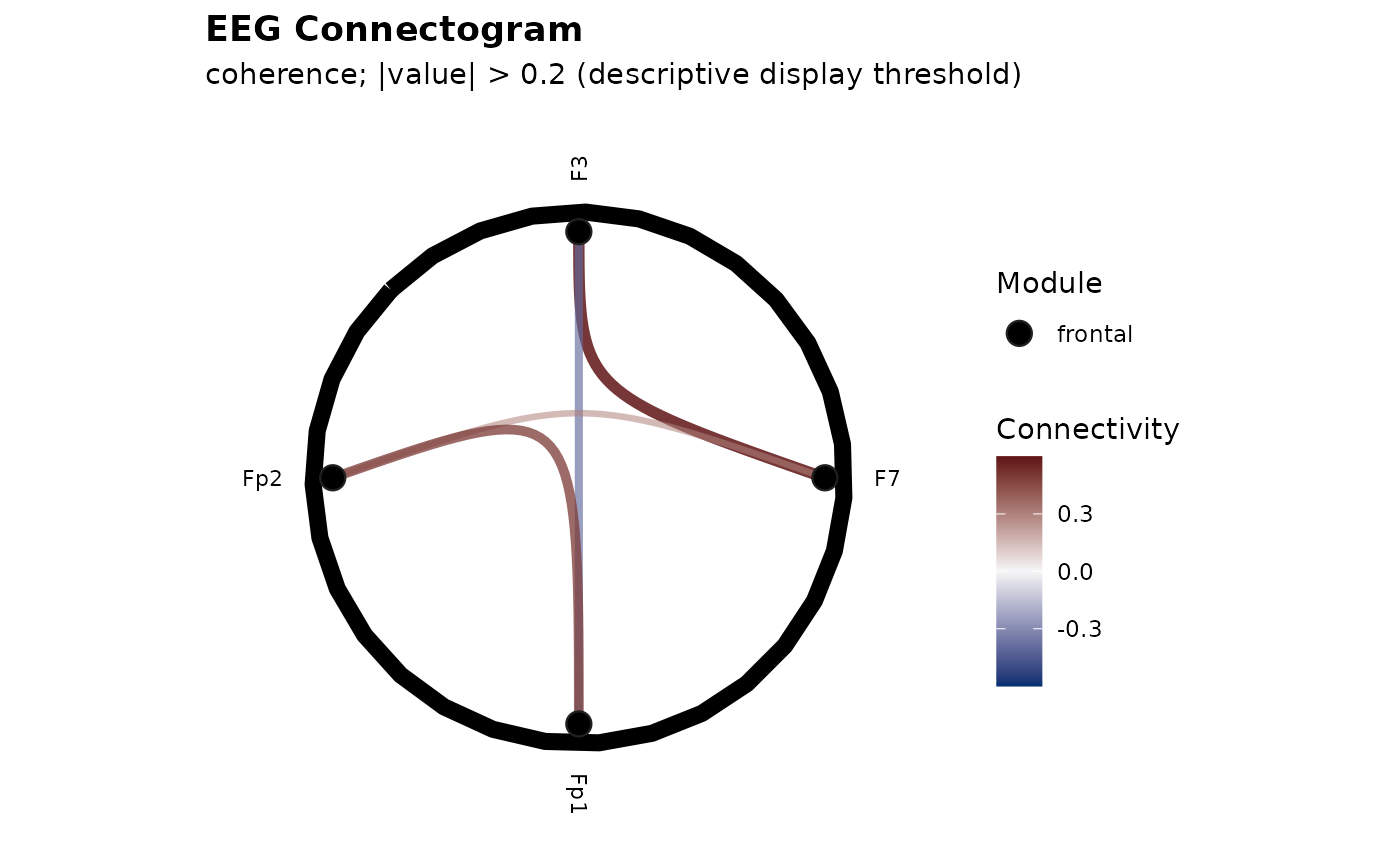
Draws a deterministic circular view of a connectivity matrix stored in
metadata(x)$connectivity$matrix. Symmetric matrices are represented
by one edge per unordered channel pair. Asymmetric matrices retain every
ordered entry, following the PhysioEEG directed-matrix convention of rows
as targets and columns as sources.
Usage
eegPlotConnectogram(
  x,
  order = c("hemisphere", "lobe", "cluster"),
  modules = NULL,
  threshold = NULL,
  bundle = TRUE
)
Arguments
- x
A PhysioExperiment with a finite square numeric matrix at
metadata(x)$connectivity$matrix.- order
Exactly one node ordering:
"hemisphere","lobe", or"cluster". Cluster ordering uses average-linkage clustering of symmetrized absolute connectivity and deterministic merge orientation.- modules
Optional module declaration. Supply a named character or factor vector, or a data frame with unique
labelandmodulecolumns covering every channel. IfNULL, an exactcolData(x)$modulecolumn is used when present, otherwise lobe.- threshold
A finite non-negative scalar, or
NULLfor zero.- bundle
One non-missing logical scalar. If
TRUE, edges follow deterministic cubic Bezier paths through module hubs; otherwise they are straight.
Value
A ggplot2 object. Resolved node, edge, path, module-arc, and setting
tables are available in attr(plot, "connectogram_data").
Details
The threshold is a strict absolute display threshold
(abs(value) > threshold); it is not a p-value or a corrected
significance mask. Hemisphere and lobe are inferred only for recognized
10-20/10-10 labels. Other labels remain "unknown" unless explicit
colData columns are supplied. Label tie-breaking uses a stable UTF-8
byte key. Edge identifiers length-prefix both endpoint labels so labels
containing the visible " -- " or " -> " separators cannot
collide.
Examples
if (requireNamespace("ggplot2", quietly = TRUE)) {
  pe <- make_eeg(n_time = 1000, n_channels = 4, sr = 250)
  mat <- matrix(c(
    1, 0.5, 0, -0.4,
    0.5, 1, 0.3, 0,
    0, 0.3, 1, 0.6,
    -0.4, 0, 0.6, 1
  ), 4, 4)
  labels <- SummarizedExperiment::colData(pe)$label
  dimnames(mat) <- list(labels, labels)
  S4Vectors::metadata(pe)$connectivity <- list(
    matrix = mat, method = "coherence", band = c(8, 13)
  )
  eegPlotConnectogram(pe, threshold = 0.2)
}