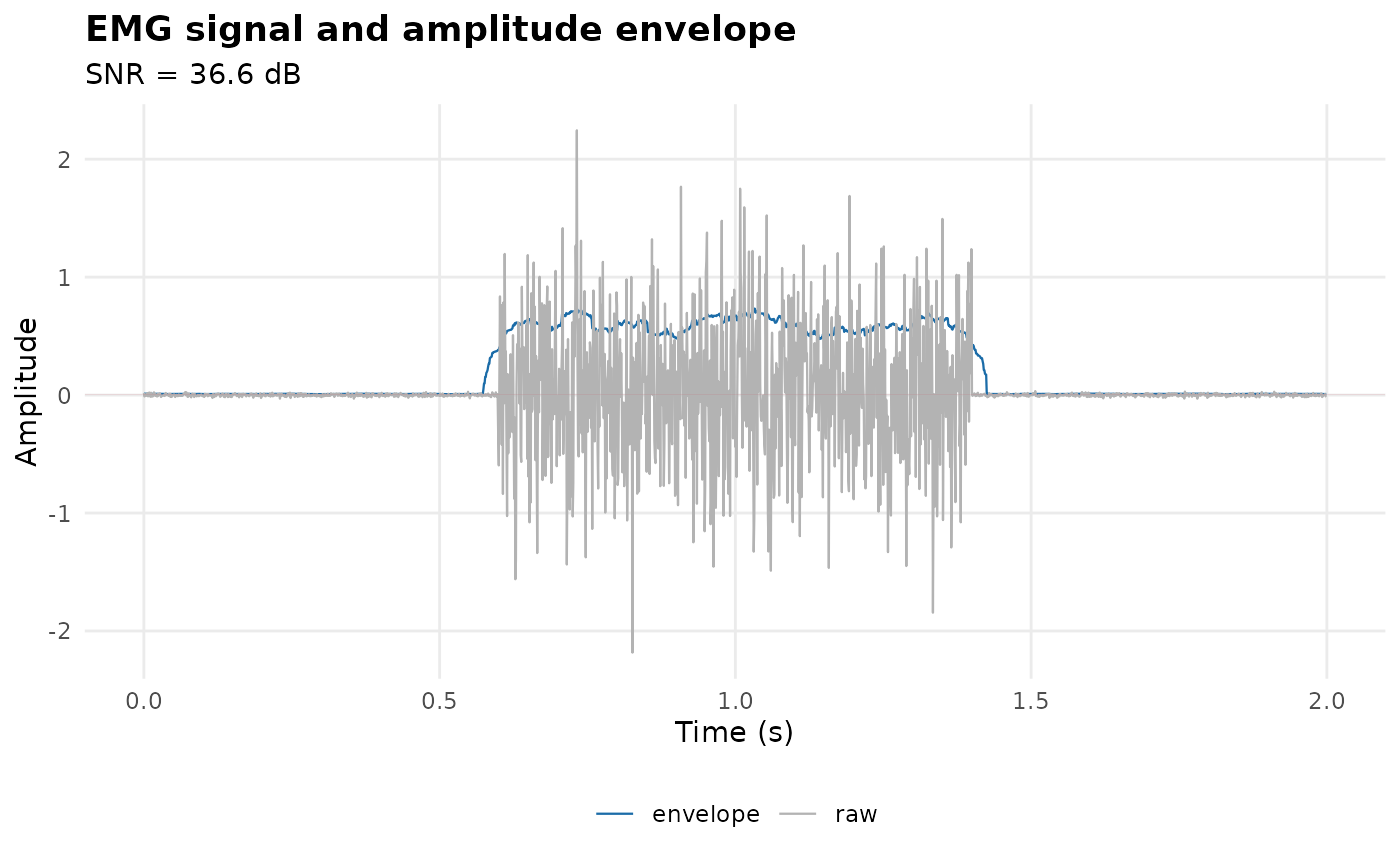
Plots the raw signal and its amplitude envelope for one channel, optionally
shading the resting noise floor from emgQualityCheck().
Usage
plotEmgEnvelope(
  x,
  channel = 1,
  method = "rms",
  window_ms = 50,
  qc = TRUE,
  assay_name = NULL
)
Arguments
- x
A PhysioExperiment object with EMG data.
- channel
Channel index or label to plot (default: 1).
- method
Envelope method passed to
emgEnvelope()(default: "rms").- window_ms
Envelope window in ms (default: 50).
- qc
If TRUE (default), shade the resting noise floor and annotate SNR.
- assay_name
Input assay name (default: first assay).
References
De Luca, C.J. (1997). "The use of surface electromyography in biomechanics." Journal of Applied Biomechanics, 13(2), 135-163. doi:10.1123/jab.13.2.135
Examples
pe <- make_emg(n_time = 2000, n_channels = 1)
plotEmgEnvelope(pe)