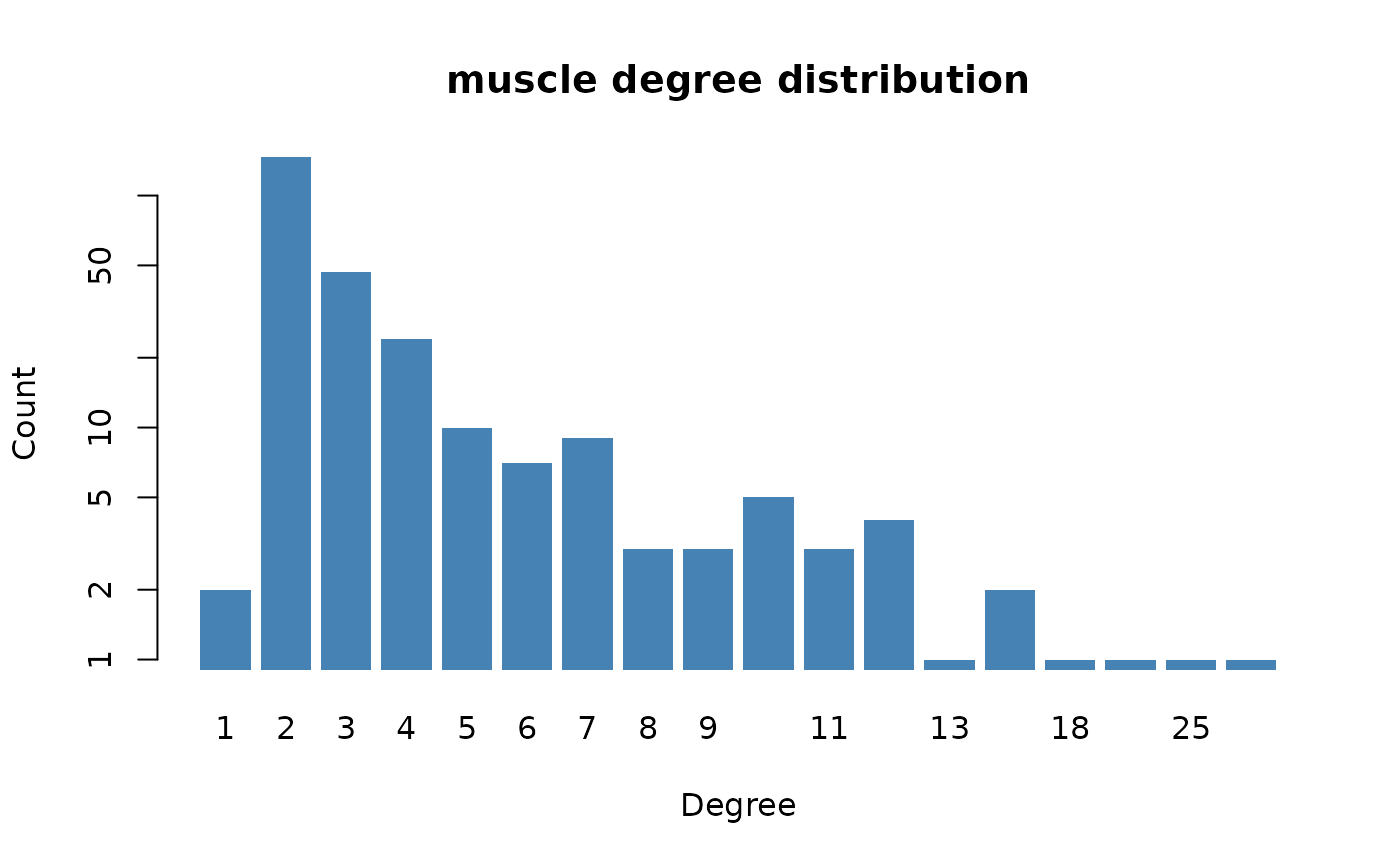
Plots the degree distribution of the hypergraph, comparing real and null model distributions. Reproduces Fig 2e.
Usage
plotDegreeDistribution(
  hg = NULL,
  type = c("muscle", "bone"),
  null_dist = NULL,
  log_scale = TRUE,
  ...
)Examples
hg <- MSKHypergraph()
plotDegreeDistribution(hg, type = "muscle")