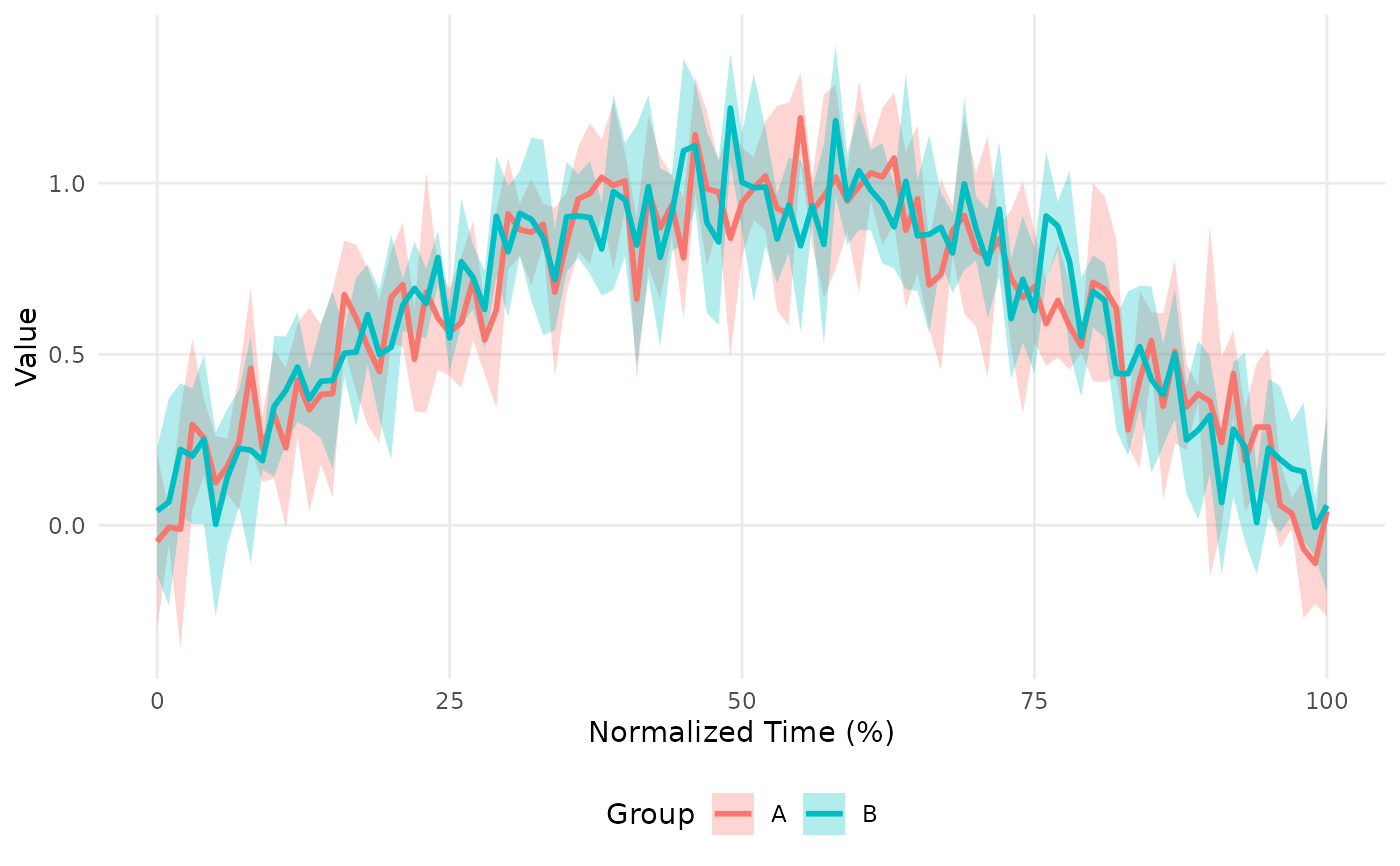
Compares waveforms between groups with schema-aware formatting.
Usage
plotGroupComparison(
  x,
  groups,
  schema = NULL,
  events = NULL,
  show_individual = FALSE,
  ci = 0.95,
  xlab = NULL,
  ylab = "Value",
  title = NULL,
  group_colors = NULL,
  ...
)
Arguments
- x
Normalized data (matrix: time x samples)
- groups
Factor or character vector indicating group membership
- schema
TaskSchema object
- events
Optional detected_events
- show_individual
Show individual waveforms
- ci
Confidence interval level
- xlab
X-axis label
- ylab
Y-axis label
- title
Plot title
- group_colors
Named vector of colors for groups
- ...
Additional arguments
See also
plotCycle() for single-group cycle visualization,
plotWaveformComparison() for alternative group comparison plots.