Skip to contents

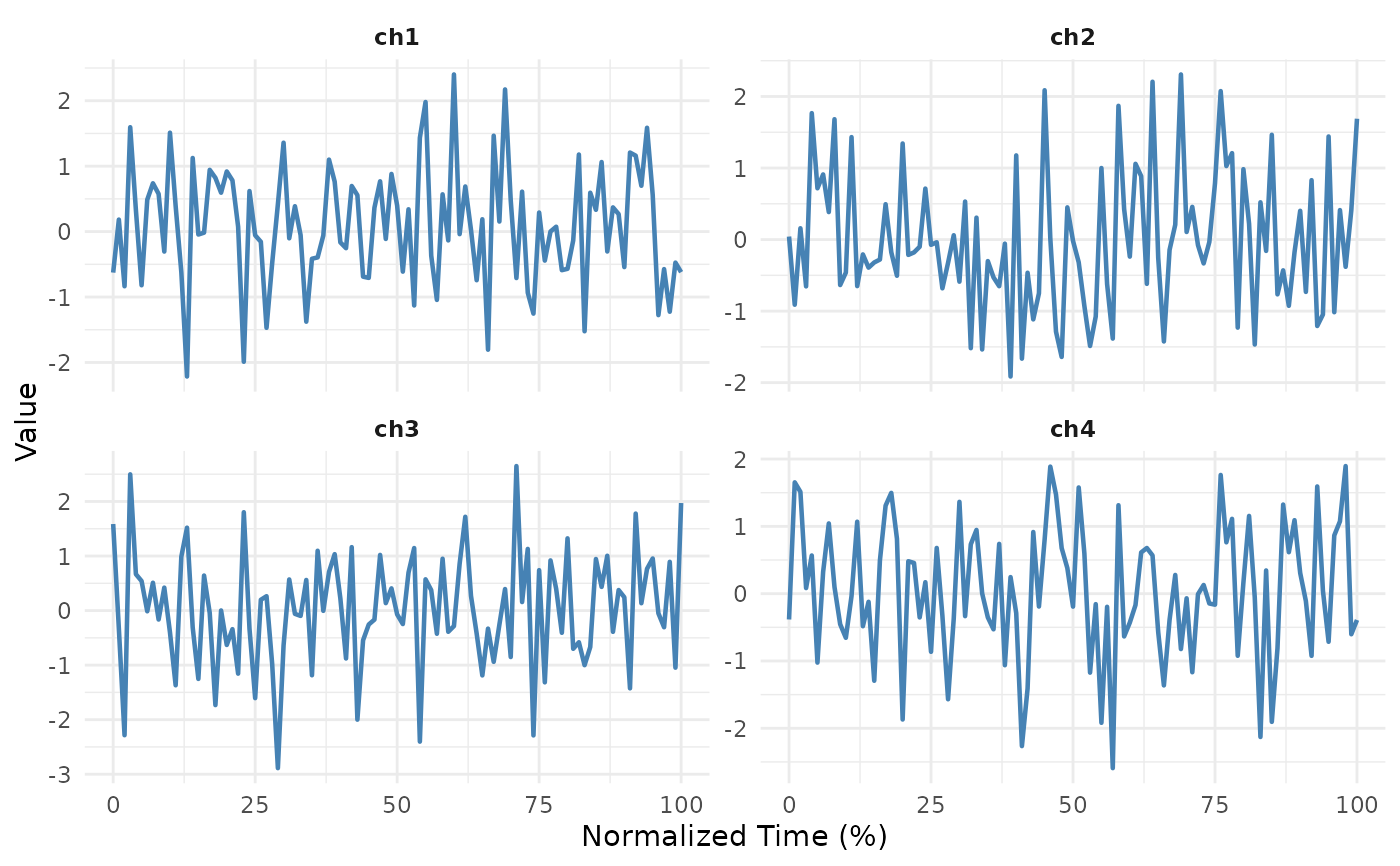
Creates a faceted plot showing multiple channels or variables.

Usage

plotMultiPanel(
  x,
  schema = NULL,
  channels = NULL,
  facet_scales = "free_y",
  show_mean = TRUE,
  show_sd = TRUE,
  ...
)

Arguments

x

Normalized data (matrix or 3D array)

schema

TaskSchema object

channels

Channels to plot (indices or names)

facet_scales

Scales for faceting ("free_y", "fixed", etc.)

show_mean

Show mean across trials

show_sd

Show SD bands

...

Additional arguments passed to plotCycle

Value

A ggplot object

References

Wickham H (2016). "ggplot2: Elegant Graphics for Data Analysis." Springer.

See also

plotCycle() for single-channel cycle visualization, plotGroupComparison() for between-group comparisons.