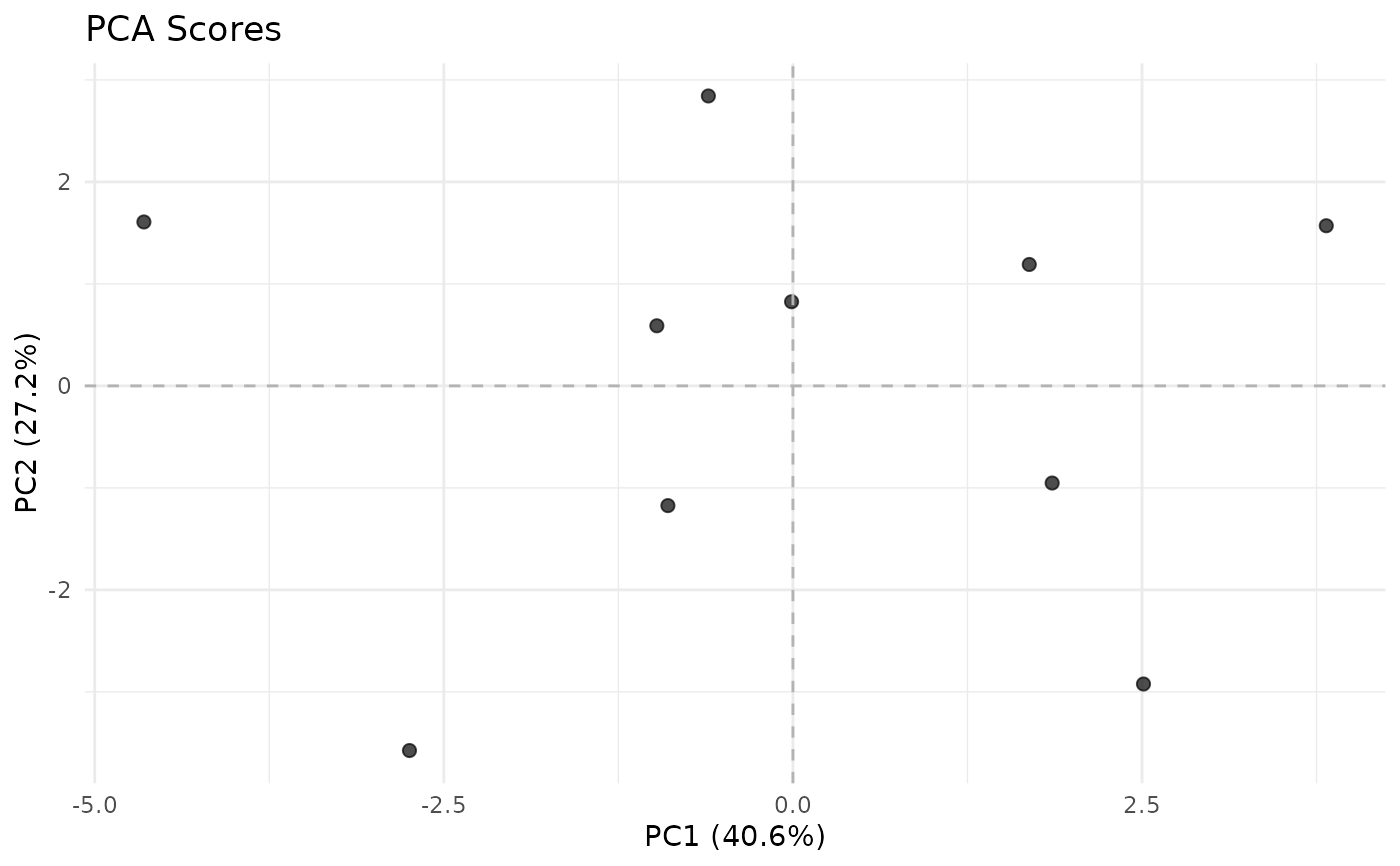
Creates a scatter plot of PCA scores.
Usage
plotPCAScatter(x, components = c(1, 2), groups = NULL, labels = NULL)References
van der Maaten L, Hinton G (2008). "Visualizing Data using t-SNE." Journal of Machine Learning Research, 9, 2579-2605.
Examples
set.seed(1)
d <- matrix(rnorm(1000), 100, 10)
pca <- waveformPCA(d, method = "features")
plotPCAScatter(pca)