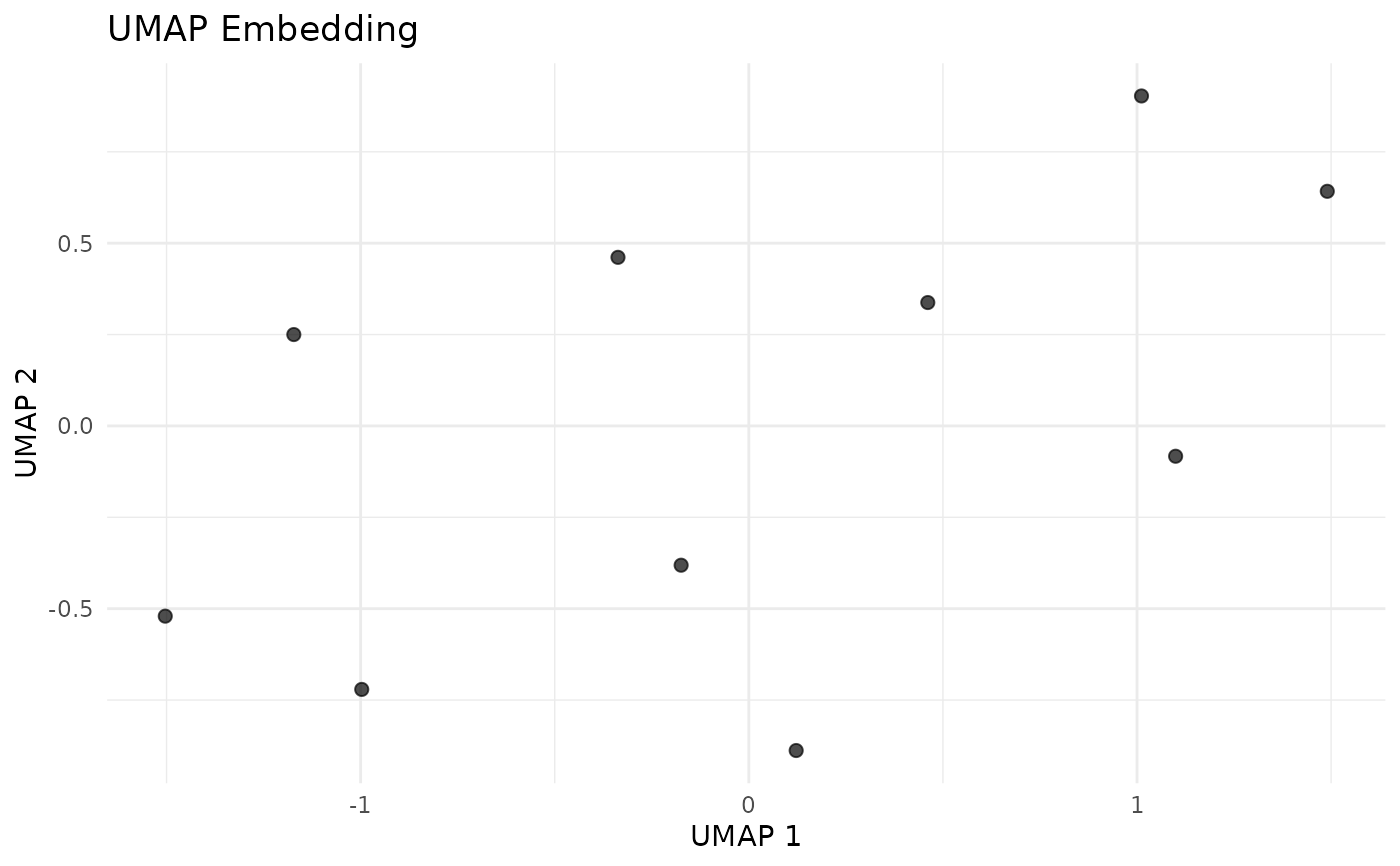
Creates a scatter plot of UMAP embedding.
References
van der Maaten L, Hinton G (2008). "Visualizing Data using t-SNE." Journal of Machine Learning Research, 9, 2579-2605.
Examples
if (requireNamespace("uwot", quietly = TRUE)) {
  set.seed(1)
  d <- matrix(rnorm(1000), 100, 10)
  plotUMAP(waveformUMAP(d, n_neighbors = 5))
}