Skip to contents

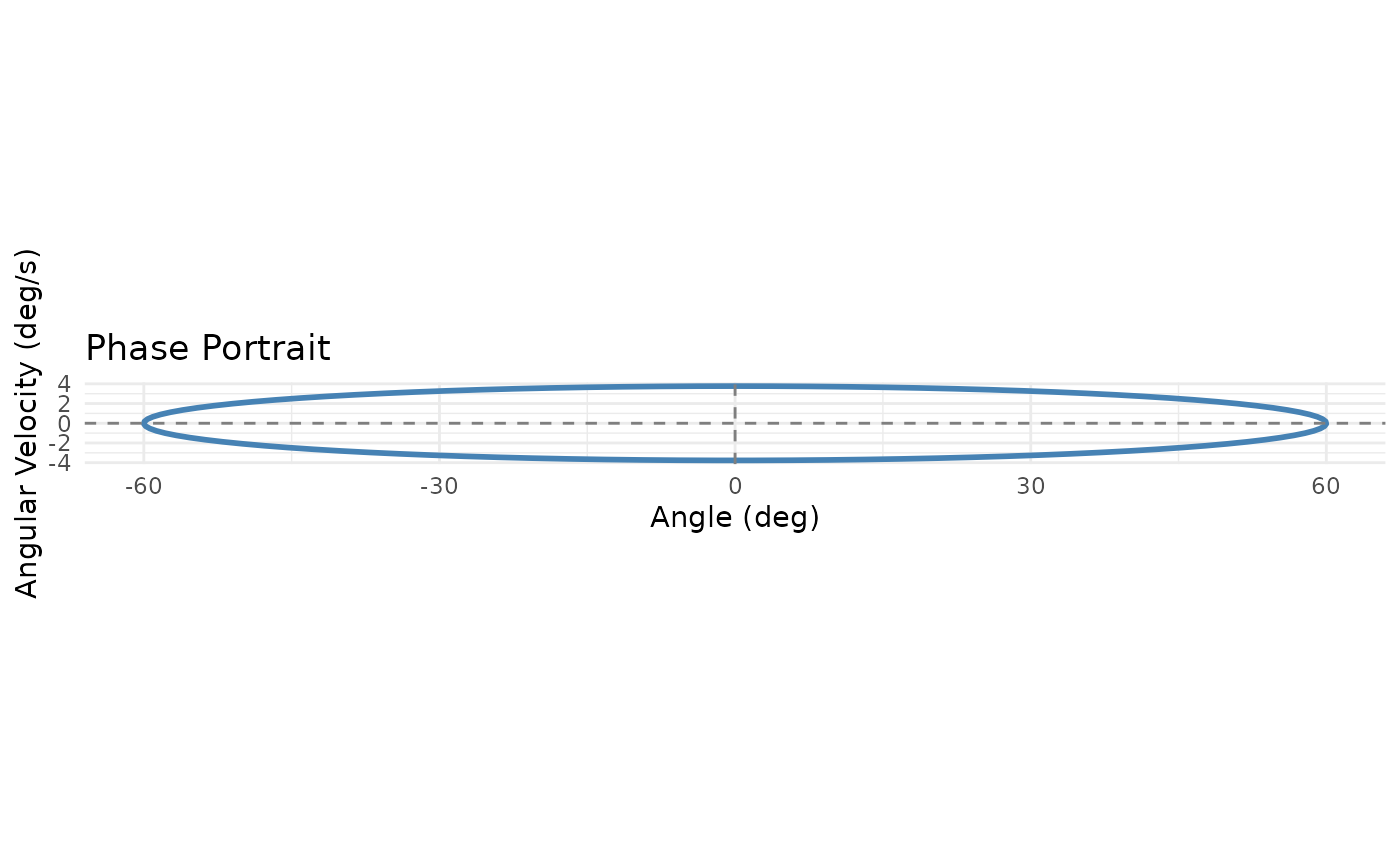
Creates a phase portrait (angle vs angular velocity) for analyzing movement dynamics and coordination patterns.

Usage

plotPhasePortrait(
  angle,
  velocity = NULL,
  sampling_rate = 100,
  groups = NULL,
  normalize = FALSE,
  title = "Phase Portrait"
)

Arguments

angle

Angle time series (vector or matrix).

velocity

Angular velocity. If NULL, computed from angle.

sampling_rate

Sampling rate (needed if velocity computed).

groups

Optional grouping factor.

normalize

Logical; normalize to unit circle.

title

Plot title.

Value

A ggplot object.

References

Wickham H (2016). "ggplot2: Elegant Graphics for Data Analysis." Springer.

See also

computeVelocity() for computing angular velocities from position data, plotGaitCycle() for time-domain gait cycle visualization.
Examples

# Phase portrait of knee angle
set.seed(123)
t <- seq(0, 2*pi, length.out = 100)
angle <- sin(t) * 60
velocity <- cos(t) * 60 * (2*pi/100)  # Derivative

plotPhasePortrait(angle, velocity)