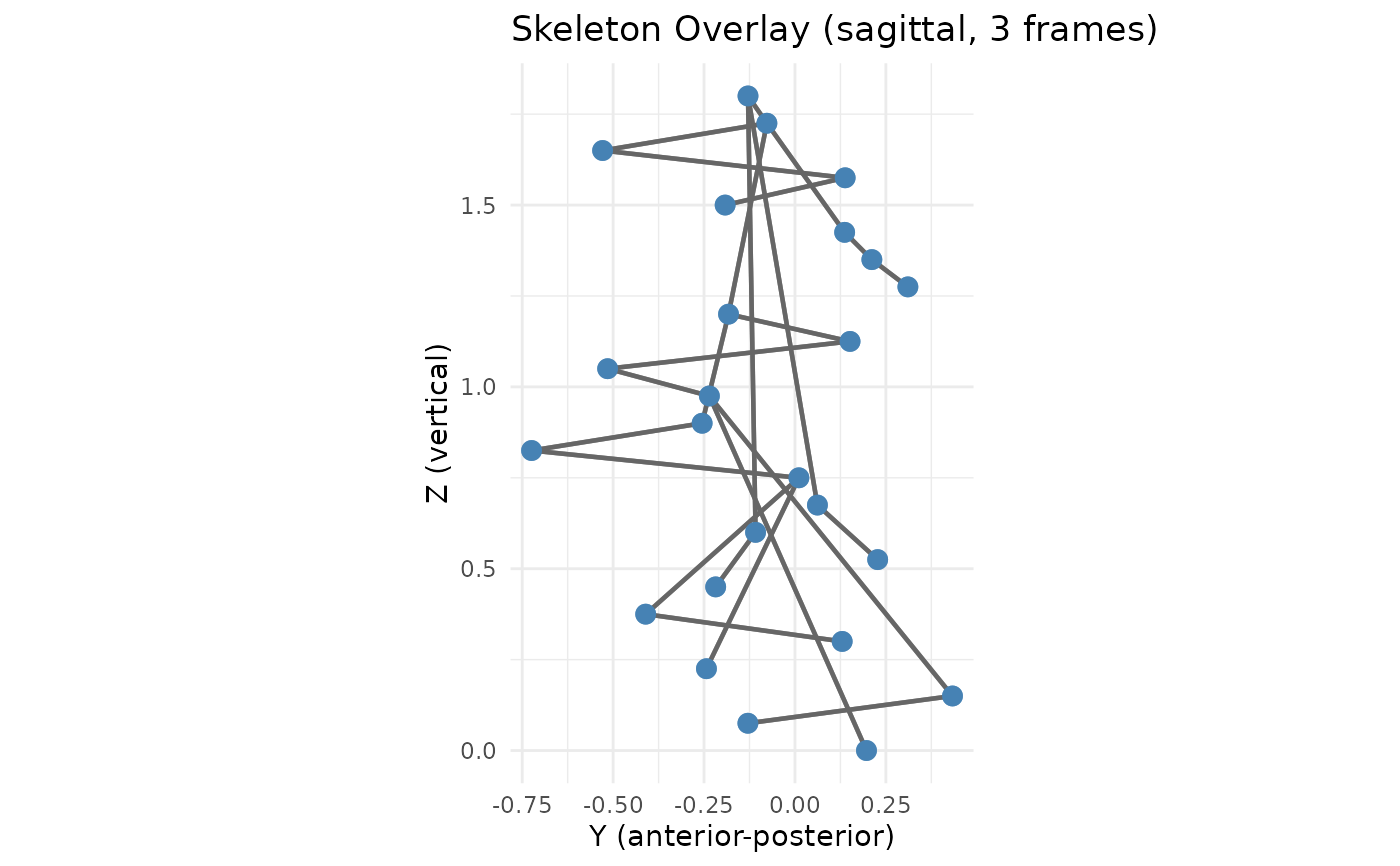
Draws multiple frames on the same plot. Earlier frames are rendered with
lower opacity when alpha_decay = TRUE.
Usage
plotSkeletonOverlay(
  pe,
  skeleton,
  frames,
  plane = c("sagittal", "frontal", "transverse"),
  alpha_decay = TRUE,
  base_alpha = 0.2,
  show_labels = FALSE,
  point_size = 3,
  segment_color = "gray40",
  title = NULL
)
Arguments
- pe
A PhysioExperiment object with
position_x,position_y, andposition_zassays (columns named by keypoint label).- skeleton
A
SkeletonModelobject whose keypoint labels match column names in the position assays.- frames
Integer vector of frame indices to overlay.
- plane
Anatomical plane for projection:
"sagittal"(drop X),"frontal"(drop Y), or"transverse"(drop Z).- alpha_decay
Logical; if
TRUE, earlier frames have lower opacity (linearly from 0.2 to 1.0).- base_alpha
Minimum alpha for the earliest frame (default 0.2).
- show_labels
Logical; annotate markers with their labels.
- point_size
Marker point size (default 3).
- segment_color
Color for bone segments (default
"gray40").- title
Plot title. If
NULL, auto-generated.
See also
plotSkeleton() for single-frame skeleton visualization,
plotSkeletonSequence() for multi-frame faceted display.
Examples
sk <- define_skeleton("BODY_25")
labels <- sk$keypoints$label
set.seed(42)
nk <- length(labels); nf <- 10
mk <- function(b) matrix(rep(b, each = nf), nf)
px <- mk(rnorm(nk, 0, 0.3)); py <- mk(rnorm(nk, 0, 0.3))
pz <- mk(seq(1.8, 0, length.out = nk))
colnames(px) <- colnames(py) <- colnames(pz) <- labels
pe <- PhysioExperiment(assays = S4Vectors::SimpleList(
    position_x = px, position_y = py, position_z = pz),
  colData = S4Vectors::DataFrame(label = labels, type = rep("keypoint", nk)),
  samplingRate = 30)
plotSkeletonOverlay(pe, sk, frames = c(1, 5, 10))