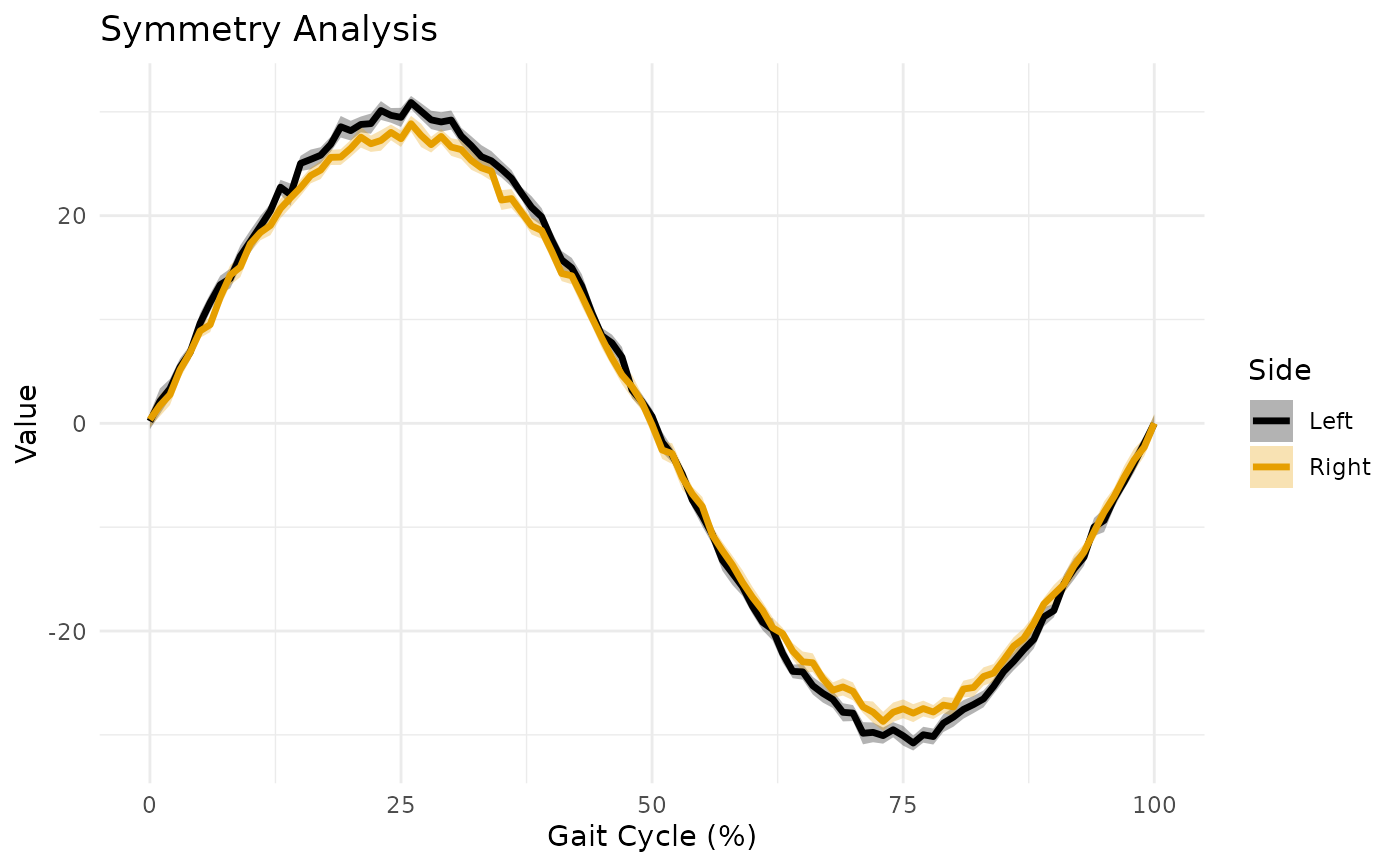
Creates a symmetry plot comparing bilateral waveforms, useful for gait symmetry analysis.
Usage
plotSymmetry(
  left,
  right,
  time_axis = NULL,
  ci = 0.95,
  show_diagonal = TRUE,
  plot_type = c("overlay", "scatter"),
  title = "Symmetry Analysis"
)
Arguments
- left
Matrix of left side waveforms (time x observations).
- right
Matrix of right side waveforms (time x observations).
- time_axis
Optional time axis values.
- ci
Confidence interval level.
- show_diagonal
Logical; show y=x diagonal reference line.
- plot_type
"overlay" for time series, "scatter" for L vs R scatter.
- title
Plot title.
See also
plotWaveformComparison() for multi-group waveform comparisons,
calculateStepSymmetry() for quantifying gait symmetry,
symmetryIndex() for computing symmetry indices.
Examples
# Compare left and right knee angles
set.seed(123)
t <- seq(0, 100, length.out = 101)
left <- sapply(1:20, function(i) sin(2*pi*t/100) * 30 + rnorm(101, 0, 2))
right <- sapply(1:20, function(i) sin(2*pi*t/100) * 28 + rnorm(101, 0, 2))  # Slight asymmetry

plotSymmetry(left, right, time_axis = t, plot_type = "overlay")