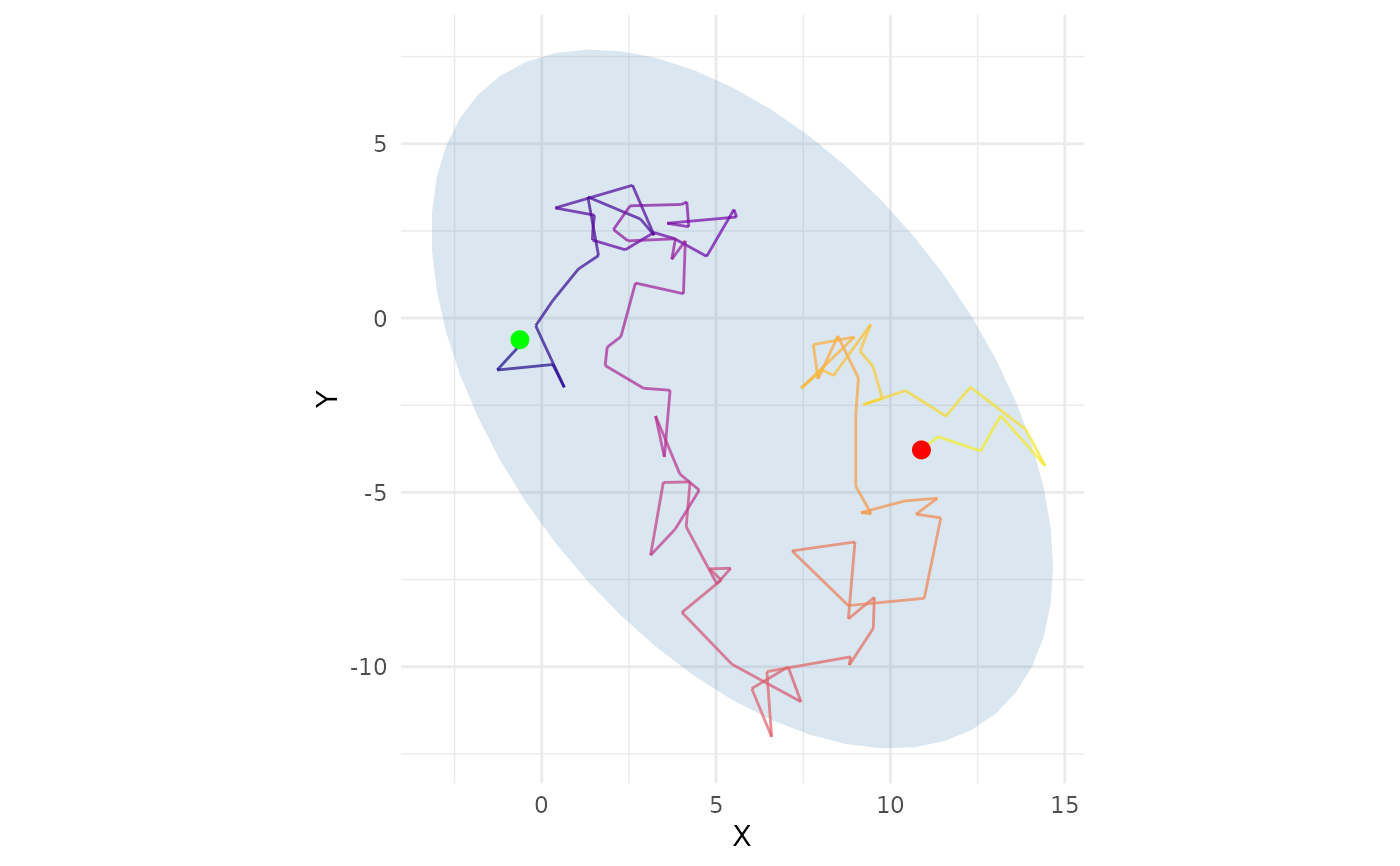
Plots 2D trajectory, useful for balance (CoP) or cutting (CoM) analysis.
Usage
plotTrajectory(
  x,
  y,
  schema = NULL,
  show_path = TRUE,
  show_points = FALSE,
  show_ellipse = TRUE,
  ellipse_ci = 0.95,
  show_start_end = TRUE,
  color_by = NULL,
  xlab = NULL,
  ylab = NULL,
  title = NULL,
  ...
)
Arguments
- x
X-coordinate data
- y
Y-coordinate data
- schema
TaskSchema object
- show_path
Show trajectory path
- show_points
Show individual points
- show_ellipse
Show confidence ellipse
- ellipse_ci
Confidence level for ellipse
- show_start_end
Mark start and end points
- color_by
Optional variable for coloring (e.g., time)
- xlab
X-axis label
- ylab
Y-axis label
- title
Plot title
- ...
Additional arguments
See also
plotSkeleton() for full-body skeleton visualization,
plotPhasePortrait() for phase-space trajectory plots.