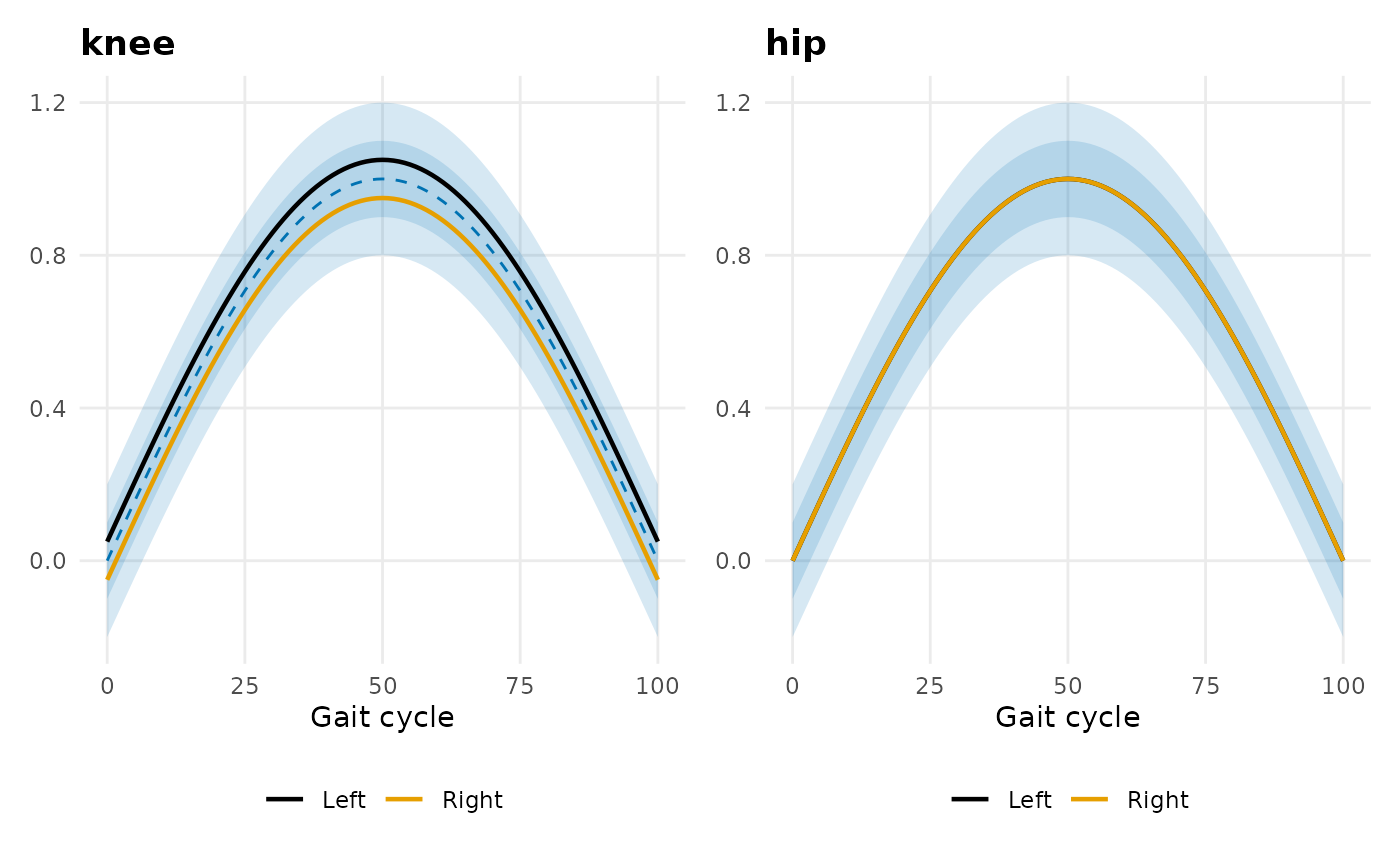
Composes a multi-panel clinical gait report: one waveform panel per gait
variable (a colorblind-safe normative \(\pm\)SD corridor from
plotNormativeBand overlaid with the subject's Left and Right
mean traces and optional event markers), followed by a gait-index dashboard
(GDI / GPS / Movement Analysis Profile). Panels are laid out with
patchwork.
Usage
clinicalGaitReport(
  pe,
  norm,
  events = NULL,
  sides = c("L", "R"),
  indices = TRUE
)
Arguments
- pe
A named list of per-variable side-split cycle waveforms:
pe[[variable]]is a list with$leftand$right, each a numeric cycle waveform or a points-by-cycles matrix (averaged across cycles). Variables are matched tonorm$variablesby name; kinetic variables (moments/power) can be included whennormcarries their corridors.- norm
A
gait_norm-like list (e.g. fromPhysioGaitNorm::loadGaitNorm()) with$variables, row-named$meanand$sdmatrices (variables x cycle points), and optionally$percentand$features(for the GDI).- events
Optional numeric vector of gait-cycle percentages at which to draw event markers (e.g. toe-off) on every waveform panel.
- sides
Which sides to overlay (currently informational; both Left and Right are drawn).
- indices
Logical; if
TRUE(default) append the gait-index dashboard panel (requires PhysioMoCap and all norm variables present inpe); omitted with a warning if it cannot be computed.
Examples
# clinicalGaitReport() composes panels with patchwork (a Suggests dependency);
# indices = FALSE keeps the gait-index panel (and PhysioMoCap) out of the way.
if (requireNamespace("patchwork", quietly = TRUE)) {
  np <- 101
  vars <- c("knee", "hip")
  ref <- sin(seq(0, pi, length.out = np))
  norm <- list(
    variables = vars,
    mean = matrix(rep(ref, 2), nrow = 2, byrow = TRUE,
                  dimnames = list(vars, NULL)),
    sd = matrix(0.1, nrow = 2, ncol = np, dimnames = list(vars, NULL)),
    percent = seq(0, 100, length.out = np))
  pe <- list(
    knee = list(left = ref + 0.05, right = ref - 0.05),
    hip  = list(left = ref,        right = ref))
  clinicalGaitReport(pe, norm, indices = FALSE)
}