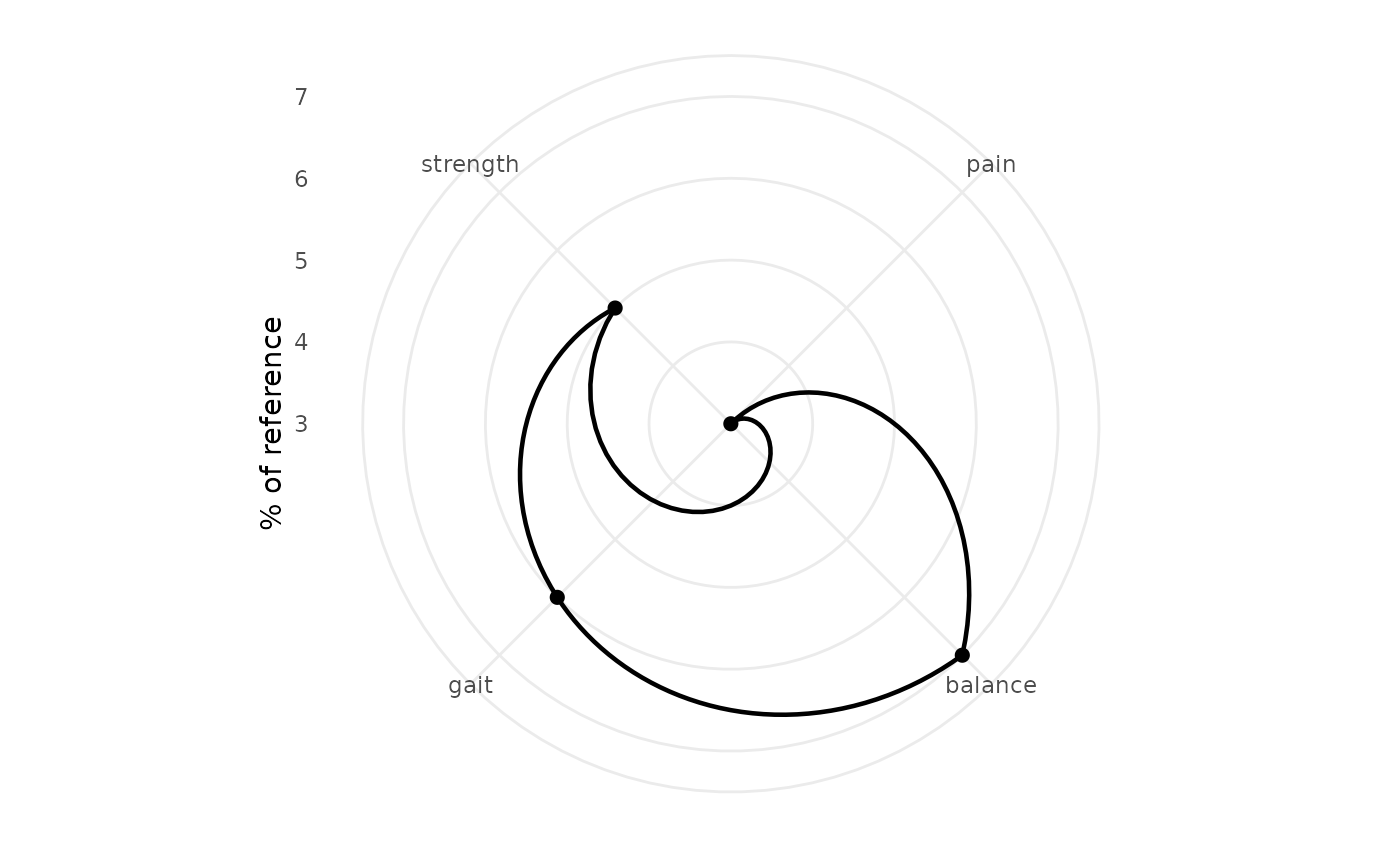
Plots a rehabilitation outcome profile across domains as a radar chart, with an optional normative reference polygon and multi-timepoint overlay. Uses the ecosystem colorblind-safe palette and report theme.
Usage
plotOutcomeRadar(
  profile,
  reference = NULL,
  normalize = c("percent", "z"),
  domains = NULL
)
Arguments
- profile
Domain scores: a named numeric vector (one timepoint), a matrix or data.frame with domains as columns and timepoints as rows, or a
MSKFunctionalOutcome(fromPhysioMSKNet::mskPredictFunctionalOutcome()), whose aggregate ROM / strength / function become the domains.- reference
Optional normative reference: a named numeric of per-domain means (for
"percent"), or a data.frame withdomain,meanandsdcolumns (required for"z"). Drawn as a reference polygon.- normalize
"percent"(each domain as a percentage of its reference mean; reference polygon at 100) or"z"(z-score versus the reference; reference polygon centered at 0).- domains
Optional character vector selecting and ordering the domains.
Examples
plotOutcomeRadar(c(pain = 3, balance = 7, gait = 6, strength = 5))