Visualizes detected communities with size information.
Examples
cm <- mskCommunityDetect(MSKHypergraph(), gamma = 4.3)
plotCommunityStructure(cm)
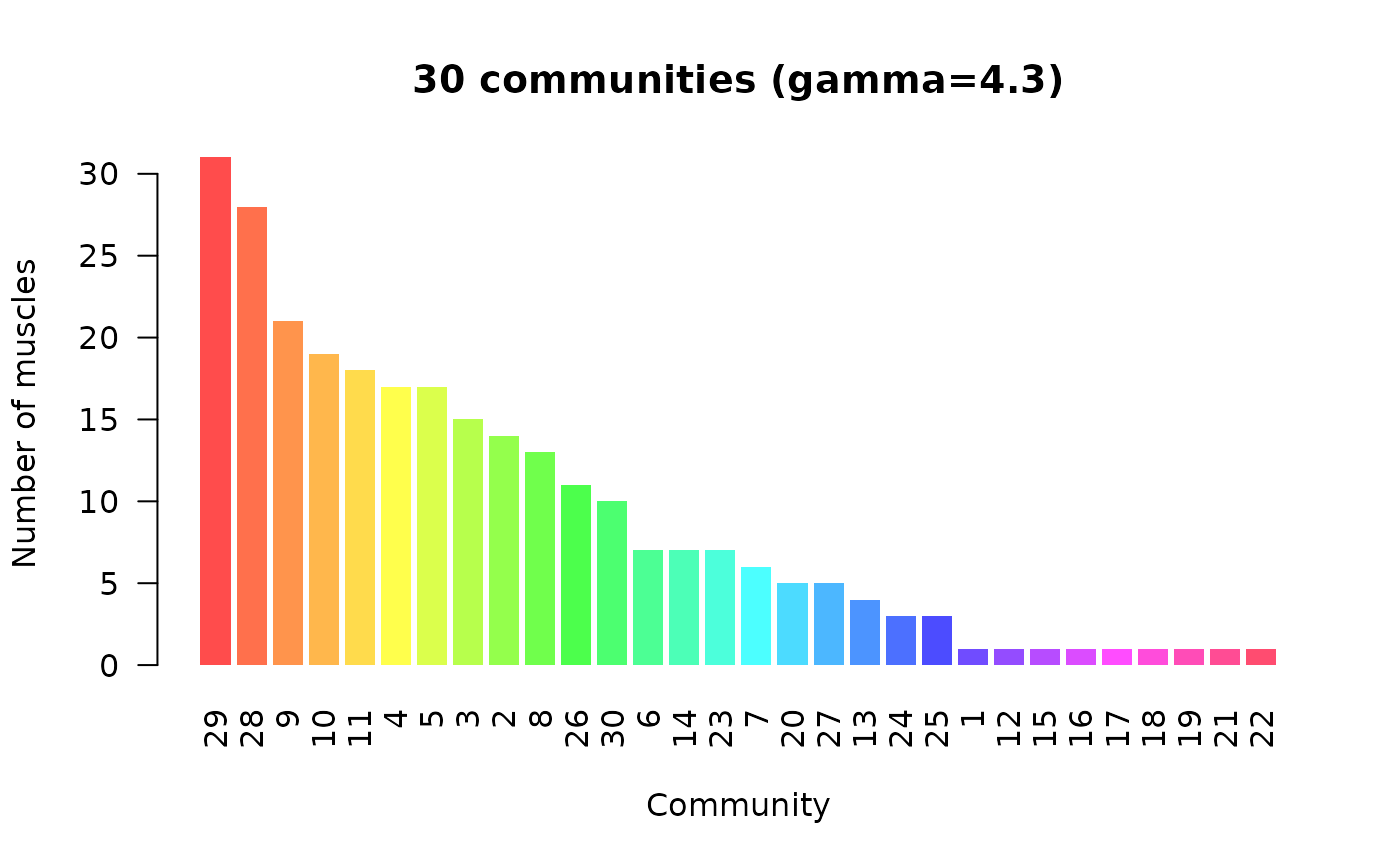
Visualizes detected communities with size information.
cm <- mskCommunityDetect(MSKHypergraph(), gamma = 4.3)
plotCommunityStructure(cm)