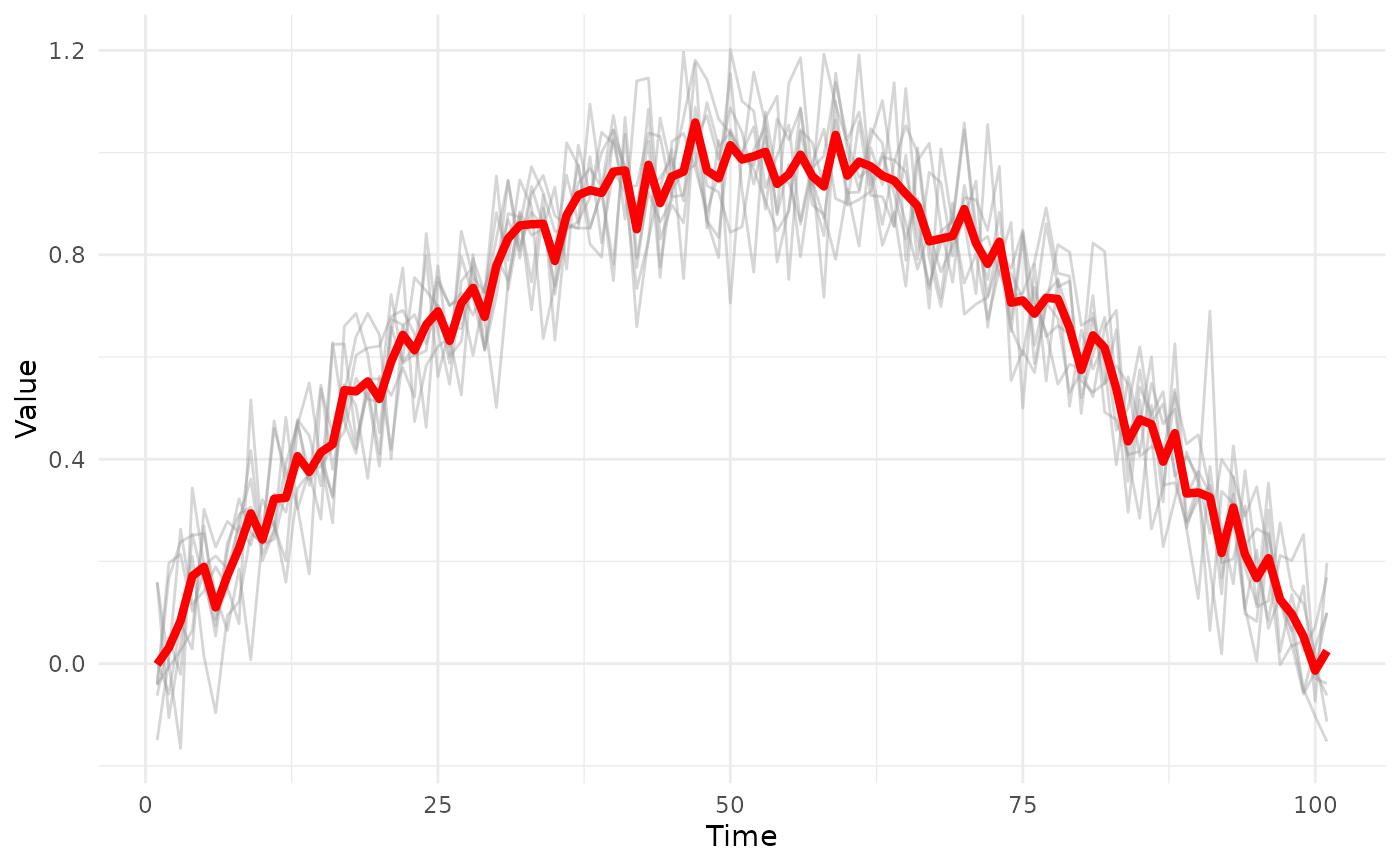
Creates a spaghetti plot showing individual subject waveforms with a highlighted mean trajectory.
Usage
plotSpaghetti(
  x,
  time_axis = NULL,
  highlight_mean = TRUE,
  individual_color = "gray60",
  mean_color = "red",
  alpha = 0.4,
  title = NULL,
  xlab = "Time",
  ylab = "Value"
)
Arguments
- x
A PhysioExperiment or matrix (time x observations).
- time_axis
Optional time axis values.
- highlight_mean
Logical; highlight mean with thick line.
- individual_color
Color for individual lines.
- mean_color
Color for mean line.
- alpha
Transparency for individual lines.
- title
Plot title.
- xlab
X-axis label.
- ylab
Y-axis label.
See also
plotGaitCycle() for gait cycle visualization with event markers,
plotWaveformComparison() for multi-group waveform comparisons.